7 Minutes

5 Important Analytical Models Every Employee Should Be Able To Access
Business intelligence tools today provide businesses with the ability to instantaneously analyze their data to derive insights. However, knowing the right questions to ask is just as critical as the BI platform you are utilizing.
This is where knowledge of the right analytical models comes into play.
Users looking to glean the right insights from their data will need to determine the right models to use when leveraging data to make better business decisions.
For example, a manufacturer looking to forecast their production schedule for the next month will be using a different predictive model versus a healthcare agency looking to predict which region in a country will likely be susceptible to a viral outbreak.
In this article, we’ll be going through an overview of the five more important predictive and analytical models users across an organization should understand and access to get the most out of your data analytics tool.
What Are Analytical Models & Why Are They Important?
Predictive analytics models are techniques used to analyze historical data, uncover patterns and trends, and using the information to make predictions on future trends.
Analytical models are built and used to support four major types of analytics that users will encounter and likely often use during their business intelligence and analytics journey.
These include descriptive analytics, diagnostic analytics, predictive analytics, and prescriptive analytics. Each of these plays a major role in helping an organization optimize its business processes while innovating ahead to stay competitive.
By understanding analytical models, users will be able to gain context into the challenge or problem they are looking to analyze.
For example, if you are in cybersecurity looking to identify potential threats and weak spots in your company’s digital infrastructure, you’ll likely want to use the outlier model to effectively spot any anomalies.
Additionally, knowing the various types of analytical models will help you effectively ask the right conversational questions to your BI tool that fits the situation.
For example, if you are looking to forecast the financial performance of the company for the upcoming year, you’d ask:
“How much revenue will we generate over the next 12 months?”
Your business intelligence tool will then use the right analytical model to analyze through all the various factors and provide a revenue forecast in return.

The 5 Key Analytics Model Every BI User Should Understand & Access
1. Trends Analytical Model
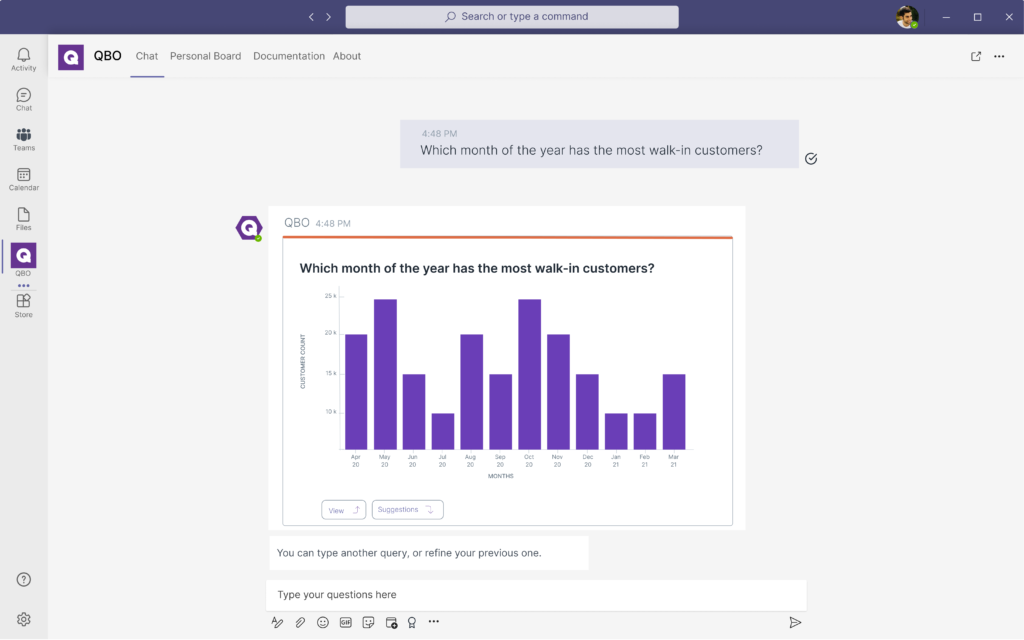
The trends analytical model helps users to identify a variety of trends that are happening within the business operations that could prove to be useful insights.
The trends model allows users to analyze business data over time to identify patterns or trends that are applicable across various industries.
Retailers will be able to use the trends analytical model to understand the best products that are selling across their stores while banks would be able to understand which customer demographics are signing up the most for their new product launch.
The trends model will be able to answer questions that include:
For a manufacturer: “Which product has been ordered the most over the last year?”

For a retailer: “Which month of the year has the most walk-in customers?”

For a bank: “Which investment products are the most popular for customers above the age of 50?"
2. Outlier Analytical Model
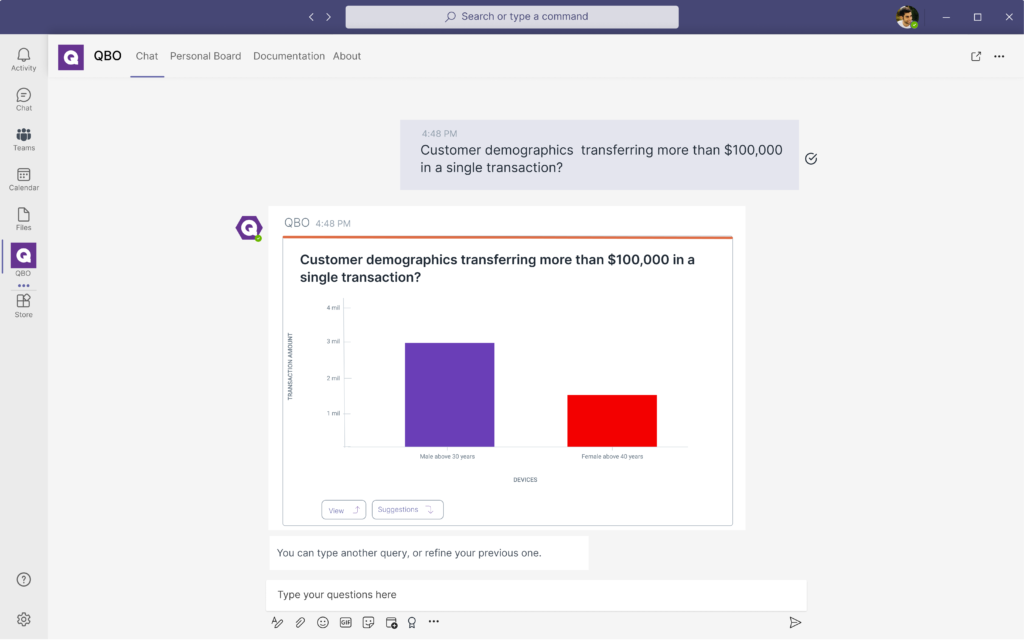
The outlier model is used to identify anomalies within a dataset and can be utilized by themselves or together with other parameters and categories.
This is useful to identify data points that deviate from the norm and is especially helpful when pre-emptively detecting such anomalies can help save organizations millions or even billions of dollars.
One good application of the outlier analytical model is helping banks comply with anti-money laundering (AML) regulations to avoid hefty fines.
Financial institutions use the outlier analytical model in their detection analytics to compare their current payments against payment history to flag transactions that are noticeably different from their past transaction history and trends.
Coupled with machine learning and artificial intelligence, the outlier analytics model can be enhanced further to provide real-time alerts to the analytics user to quickly prompt timely investigations.
The outlier model can also be used in conjunction with other analytical models to pinpoint clusters and trends of fraud in customer groups.
Users will be able to ask specific and broad questions to their data such as:
“Is this particular investment transaction fraudulent?”

“Which customer demographic is transferring more than $100,000 in a single transaction?”

“What do the cases of fraud over the last 12 months have in common?”
3. Forecasting (Time Series) Model
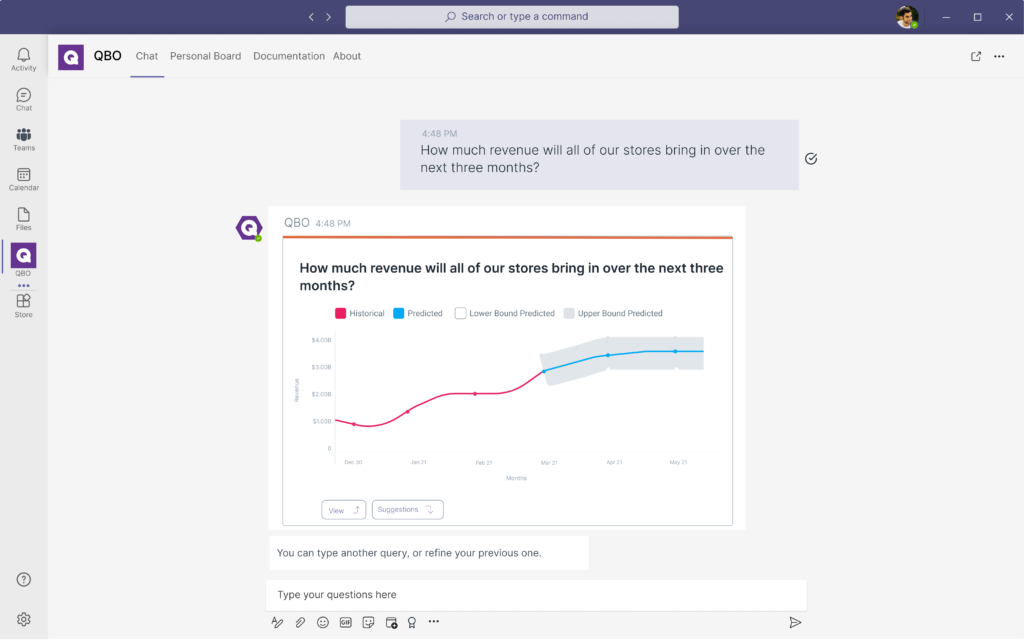
As one of the most common analytical models, the forecasting model predicts the performance of metrics based on the historical data across a myriad of interconnected datasets.
This makes it one of the most versatile, useful, and widely utilized models across various industries and operational departments.
Here are some common scenarios of how the forecasting model can be applied to various industries:
- A telecommunications company and use the forecasting model to estimate their customer churn rate for a given month
- A SaaS company can forecast its recurring revenue for the next few months to help with its budgeting
- A retailer forecasting how much inventory they should order and restock from their supplier.
Additionally, the forecast model also can be used across various time periods which will affect the forecast as it takes into account a variety of factors and variables that might occur during one time period and disappear in another.
A good example is trying to forecast a retailer’s sales by asking a question such as:
“How much revenue will all of our stores bring in over the next three months?”
Assuming the three months are October, November, and December, the forecast model could take into account a whole host of historical data that can include a delay in supplier shipment in October, a storewide promotion in November, and a seasonal holiday boost in December.
4. Variance Model
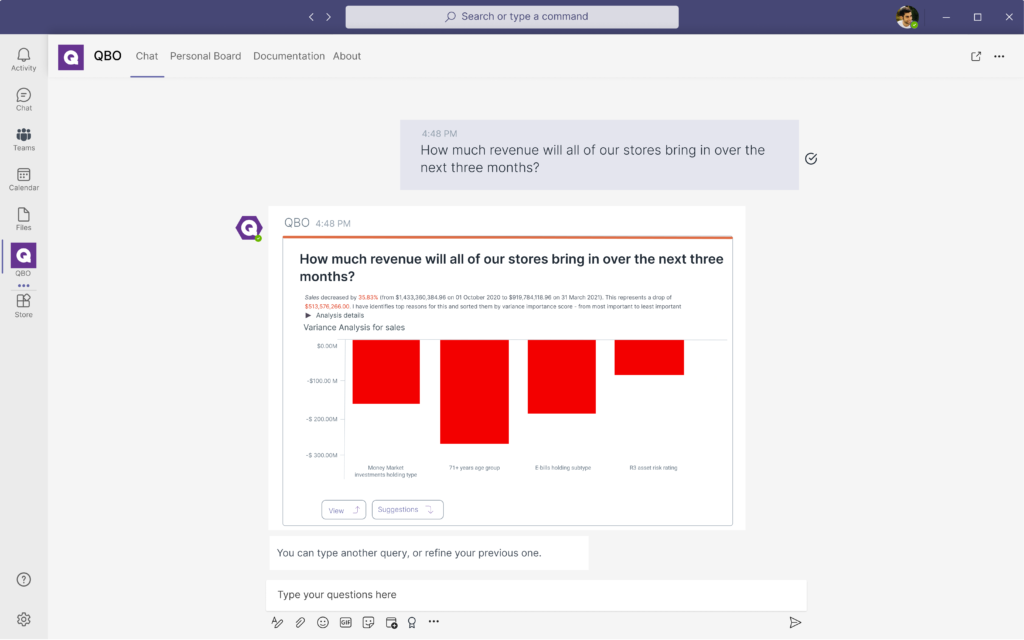
The variance model looks at the difference between the historical or planned numbers and the actual numbers that were being accomplished.
This makes this analytical model useful in identifying the root causes of changes in a particular KPI. Diagnostic analytics is an important aspect of business intelligence and is used by organizations to determine the factors and events that contributed to a positive or negative outcome that bucks expectations.
For example, in sales, users will be able to ask their data questions such as
“Why have our sales dropped over the last 6 months?”
Using the variance analytical model, business intelligence tools will analyze all interconnected datasets and variables to provide key insights on why sales have fallen – it could be from poor customer satisfaction to high renewal fees to a higher number of unqualified marketing leads.
While variance analysis is used more for looking back at the past and what went wrong, it still provides actionable insights and provides decision-makers with an understanding of the casual relationships to help tighten business processes.
5. Association Mining
The association mining model is used to observe frequently occurring patterns and associations from various datasets to draw correlations and highlight how strong a particular association is.
This analytical model is useful for a variety of applications from classifying (or grouping) data points together into distinctive categories as well as prescriptive analysis to effectively exploit correlations to drive future decision making.
For example, through association mining, it was found that insurance applicants below 30 years of age who applied for an endowment plan also bought life insurance. This association allows insurance firms to pre-emptively prepare to better engage their customers in that segment such as:
- Equipping their insurance agents with the information to cross-sell the relevant policies
- Developing new endowment + life insurance bundled policies for this particular segment
- Retargeting past endowment applicants that fall within the age group through social ads
At Unscrambl, using our conversational BI tool, Qbo, we utilized the power of association mining to help budget airlines identify which F&B products should be sold to maximize onboard sales.
Through the association mining model, it was found that customers that bought a certain set meal also bought a certain type of soda and that particular beverages were ordered during specific flight times.
This insight allowed airlines to optimize their food stock up selection before each flight takes off. By understanding the particular relationship between the type of food being ordered during particular flight routes, the time of day, and other accompanying factors, airlines were able to sell more.
This helped to bolster their revenues with high margin sales, increased customer satisfaction with more tailored menus as well as a reduction in food waste (and money) from products not being bought.

Access & Harness These Analytical Models With Qbo Today
Effective business intelligence requires users to use these analytical models, however, without a BI tool that can be easily used, effectively harnessing these models will be challenging for the average business user.
At Unscrambl, we developed Qbo, a BI tool powered by conversational analytics. This allows users to analyze their datasets by simply asking questions like they would in a conversation.
Give Qbo a try today, embark on a 14-day free trial and begin to transform your organization with actionable data-driven insights!