 7 Minutes

Data-Driven Storytelling: 6 Steps To Explore, Enchant and Engage
Storytelling has always been a powerful medium for business leaders to influence, teach and engage audiences.
Whether it is to allow an audience to better explore a complex topic, drive home a key point or convince prospects to take action, storytelling helps to bridge the gap between hard cold facts and what truly matters to us.
From a CEO looking to inspire his stakeholders through a presentation to engaging a global audience with a video ad, telling stories emotionally connects people, builds loyalty, and speaks to our values and beliefs.
However, these stories have to be grounded in facts backed up by evidence and research – especially in the business world where trust has to be won and doubts have to be erased before decisions with real commercial consequences are made.
Similarly, having just quality research and insights from high-quality data sources aren’t enough – weaving a compelling narrative around it is essential.
You’ll need data-driven storytelling.
What Is Data-Driven Storytelling
Data-driven storytelling is about presenting data & data-driven insights within the context of a story (or narrative) that connects with the audience, making it highly relatable and more understandable to drive maximum impact.
As companies increasingly begin to harness the power of their data to glean valuable insights, data-driven storytelling is the next natural step necessary to communicate key lessons and learnings to everyone.
Companies will have to learn to tell the story of their numbers and data to impact their bottom line.
Global diaper brand Huggies’s ‘No Baby Unhugged’ campaign utilized the power of data-storytelling to increase sales by 30% (not to mention acquiring over 2 million likes, comments, and social engagement).
By combining the findings of over 600 research studies that prove the benefits of hugs to babies (such as better immune systems and brain development) with an emotional-led narrative of mothers hugging their babies, the brand effectively tapped into the primal emotions of their audience and allowed them to effectively compete in a highly competitive market.
Why Data-Driven Storytelling Is So Crucial Today
With data and insights becoming increasingly ubiquitous in our daily lives, people are quickly getting overwhelmed with information.
It is the job of data-driven storytelling to quickly make sense of chaos in a way that is relatable to us to trigger that ‘aha’ moment.
Here are three reasons why data-driven storytelling is becoming an essential skill every business leader should master:
A) Building trust is harder – both on a logical & emotional level
Consumer trust today is at an all-time low, with only 13% expressing trust in their retail brands to provide effective guidance through the COVID-19 pandemic.
With data-storytelling, brands will be able to showcase evidence-based insights in a format that persuades audiences quickly and decisively.
It weaves in context and a framework for audiences to understand the facts and figures in a relevant and interesting way.
B) Raw insights are not impactful enough – they have to be presented well
While hard-hitting facts and figures themselves might have worked decades ago, retaining attention and delivering maximum value to audiences will require beautiful visualizations that frame statistics under the right context.
Under the framework of a narrative, leaders will be able to select the right types of visualizations such as trends, comparison charts, and proportions to tell a cohesive story that is compelling and easily understood.
C) Data-storytelling spurs engagement with the audience
Stories aren’t just show-and-tell sessions with a static audience.
Done right, data-storytelling gets into the minds of your audience, allowing them to relate and interpret the data according to their life experiences and unique perspective of the world.
It forces them to think, investigate the data and conduct their own research to satisfy their own curiosity – and that means building a more captive and receptive audience and leaving them with an unforgettable experience.

6 Steps To Create A Compelling Data-Driven Story
John Wilder Turkey, a famous mathematician who pioneered exploratory data analysis had a famous quote: “The greatest value of a picture is when it forces us to notice what we never expected to see.”
A powerful data-driven story is one that unlocks new insights and ideas in the minds of its audience through the strategic use of visualizations, narrative, and storytelling principles.
1. Research & Understand Your Audience Persona
The first step to creating any good story is to understand your audience persona.
One of the biggest mistakes made when it comes to data-driven storytelling is the assumption that data are the central characters of your story.
While the insight you derived might be groundbreaking, stories are almost always about people and likely either centering around your audience themselves or highly related to them.
Ask yourself these 6 key questions when it comes to defining your audience persona for the story you are crafting:
- What are the demographics of your audience?
- Who are the stakeholders involved?
- What are the challenges/issues that they are facing in their daily/professional lives?
- What KPIs or metrics are they tracking?
- What are they influenced by?
- What are their skill levels?
The more you can drill into the persona of your audience, the better your story will resonate with them.
2. Decide On The Big Takeaway Message
Every good story has a central idea, one big takeaway that audiences should leave with if they can’t recall anything else.
Understanding your big takeaway message is key in preparing your insights to substantiate it well.
If the story is about climate change, the big takeaway could be about the need to reduce plastic use in our daily lives.
With this, the right questions can be asked to your data analytics solution, especially if it is powered by conversational analytics, to extract the right insights to add credibility and cement the audience’s understanding of that take-home message.
3. Set The Context For Your Story
Context is king in storytelling and is essential in painting the background, environment, setting, and surroundings of the events in your story.
But this goes beyond just worldbuilding.
When it comes to your data-driven story, what you need to quickly establish with your audience is why the information showcased matters to them and why they should even pay attention.
For example, while a story about a startup that grew exponentially and was acquired for a billion dollars might be interesting, it still lacks context.
Now if it is added that the startup’s growth happened after the financial crisis when investments were tight and customers were hard to come by – it suddenly adds a context of ‘heroic struggle’ into the narrative.
And if your audience is startup founders, this is a context that they can either directly relate to or have given it significant thought.
4. Craft The Narrative Framework
Also known as the story arc, this is essentially the timeline of your story.
While there are many narrative models and dramatic structures you can follow, there is one that you can adopt as the skeletal framework to build your story.
This is Freytag’s pyramid that consists of 5 main phases:
Exposition:
This is where the background and context are introduced as well as showcasing the key players (or characters) to the audience.
Rising Action:
In this phase, supporting facts such as visualizations can be introduced to help support the narrative and the key message for the audience’s takeaway.
Climax:
This is the highest point or where the key takeaway or challenge will be highlighted. It is the turning point where decisions need to be made to solve a challenge or dire consequences will have to be faced.
Falling Action:
This is the phase where the dire consequences (or catastrophe) is explained with a hint of a slim possibility of reversal (backed up with statistics and data of course)
Resolution:
Finally, the story is concluded with a ray of hope as well as actionable insight and steps that the audience can immediately act upon to reach the ‘promised land’.
If your story involves a single individual or protagonist, be sure to check out Joseph Campbell’s Hero’s Journey – it is a fantastic narrative template that you can use.
5. Decide On The Key Visualizations Necessary To Showcase
Now that the story has been set, the next step is to intelligently integrate the right data and insights through visualizations.
One effective way to choose the right visualizations is to ask the right questions and select the best visualization that answers the question as directly as possible in the right context.
Here are the four commonly used data visualizations to help inspire you:
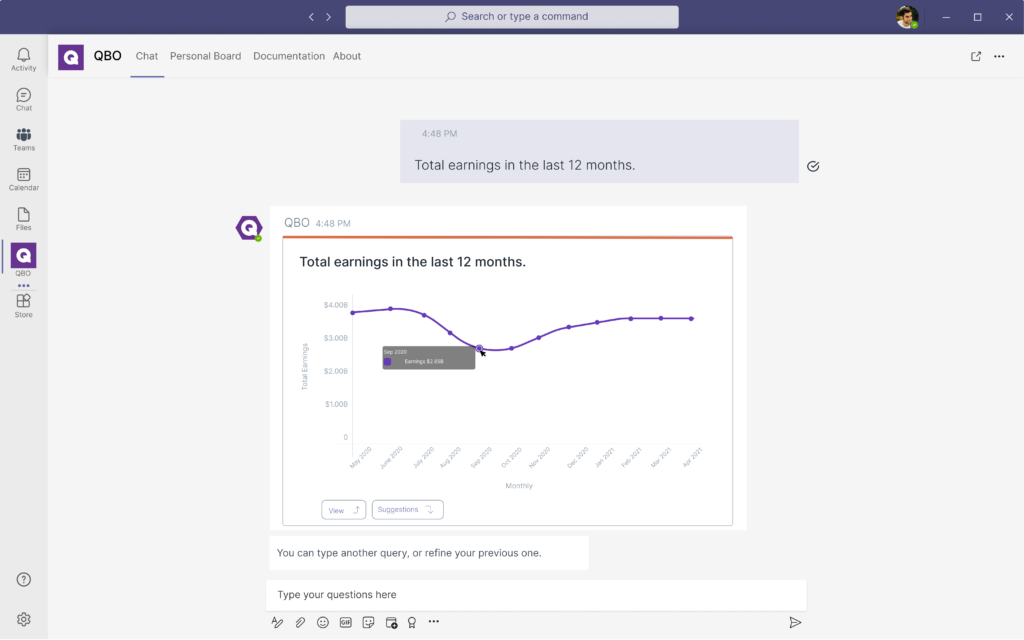
Trends:
These are perhaps the most common visualizations used in data-storytelling. It is applicable to a wide range of topics from business to population
Comparison Charts:
If your story has many players and a comparison is inevitable, this is one such visualization you can consider.
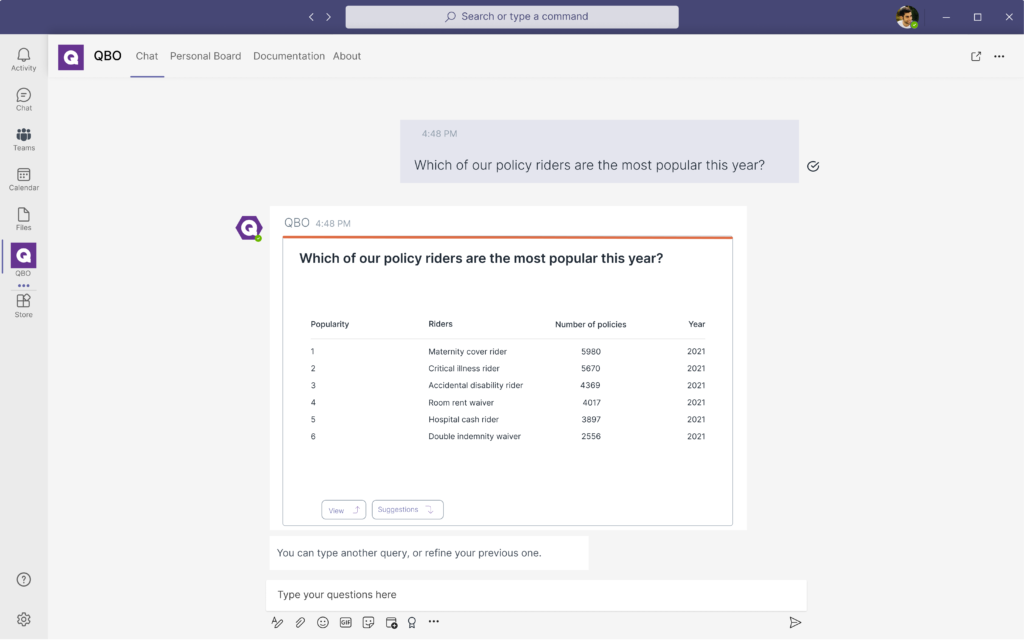
Ranking Tables:
When it comes to comparing countries, companies, and even individuals, ranking tables are a great way to quickly showcase insights in a competitive manner.
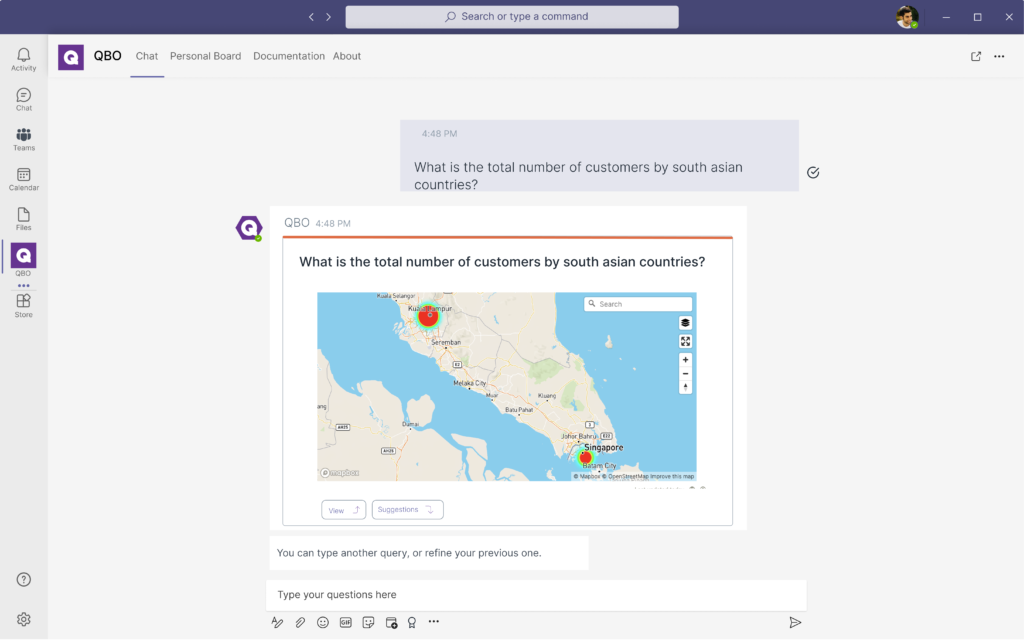
Heat Maps:
Especially powerful when it comes to stories centered around insights that revolve around volume and populations.
6. Select A Passionate Storyteller To Tell The Story
Now that your story is fully fleshed out with key insights presented in beautiful visualizations that flow well – you’re almost at the finishing line!
The final step is to appoint a storyteller in your organization to communicate these insights in a way that goes beyond a standard corporate presentation.
You’ll want to find a narrator that not only understands the story and what the insights mean, but has a flair for showmanship to effectively command and direct attention to key points of the story and even make the crowd feel tense and uncomfortable at times.

Start Telling Data-Driven Stories That Connect With Your Audience
As companies move towards being data-driven, effective storytelling is fast becoming a skill that even data scientists and analysts should learn to communicate more effectively with stakeholders throughout the organization.
At Unscrambl, we created Qbo to help swiftly derive insights from data presented in highly intuitive visualizations that are easy to understand and highly customizable to the context of your story.
Embark on a free 14-day trial today and equip your teams with an intuitive tool to power your data-driven storytelling.
