8 Minutes

10 Metrics In Google Analytics To Track, Analyze & Optimize With Augmented Intelligence
For most marketers, the website is the central hub where their marketing efforts converge.
It not only informs your visitors about what your business is about, it is the critical point of conversion where leads are generated and sales are closed.
To make informed decisions on how well your website is driving traffic and converting them, you need to be able to track its performance.
Is your content engaging enough for your audience to learn more about your brand?
Are your call to actions compelling enough for your prospects to convert into paying customers?
Thankfully, Google has provided us with a free tool – Google Analytics, to gain better access into key metrics to better understand how our marketing strategies and campaigns are performing.
While you can access a myriad of data on Google Analytics, there are a handful of metrics that you’d want to focus on and analyze with augmented intelligence to derive deeper insights.
In this article, we will go through the top 10 metrics in Google Analytics to monitor and analyze and how marketers can use augmented intelligence to glean actionable insights instantaneously from the data.

The Top 10 Google Analytics Metrics To Track & Analyze
1. Users
In Google Analytics, your ‘Users’ refers to the number of unique visitors that have visited your website.
This will be displayed directly as you enter Google Analytics, however, you can also manually access this data by heading to Audience > Overview in the left navigation bar.
Ideally, you would want the number of users to increase over time, especially if you are embarking on an organic SEO campaign that includes content creation such as blogging.
A growing number of unique visitors means your website is increasing its brand awareness and growing its traffic – a precursor to leads being generated and sales being closed.
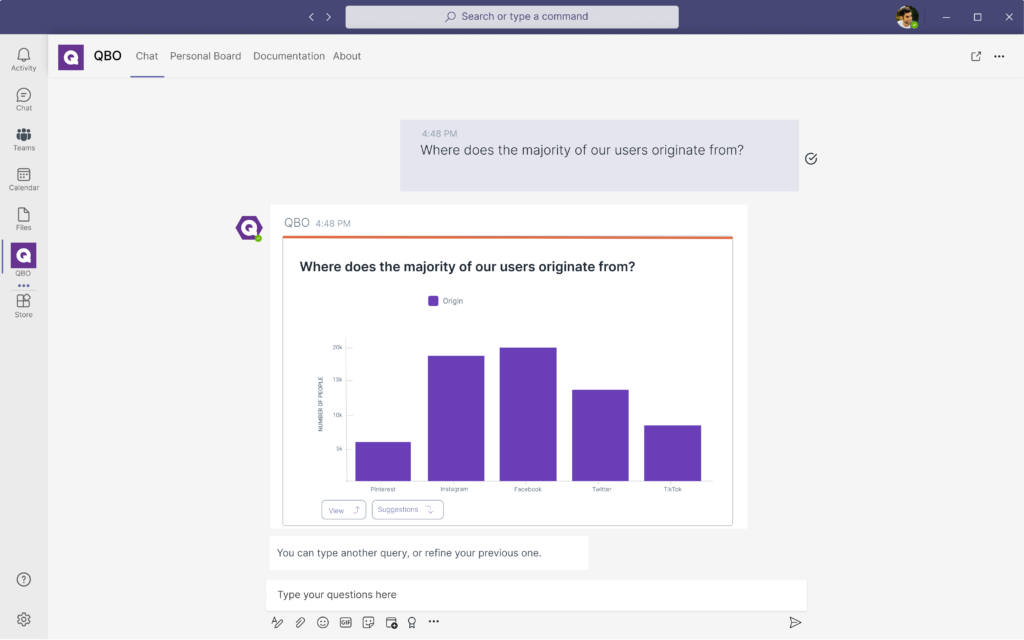
Utilizing business intelligence, powered by conversational analytics, users will be able to ask questions to their Google Analytics data to gain deeper insights.
Questions such as:
“Why has the number of Users fallen over the last 6 months?”
“Where does the majority of our users originate from?”
Can be asked, allowing you to quickly discern trends and diagnostic insights from your data.
2. Sessions
Google defines a session as a group of user interactions with your website that occurs within a given time frame. This group of user interactions can include navigating through your webpage, a transaction, email signup, or social interaction.
A session happens when a user enters your website, directly or organically, and ends after 30 minutes.
To access sessions in Google Analytics, simply head to Audience > Overview in the left navigation bar.
Tracking sessions is particularly useful in the eCommerce space where a single user can have multiple sessions as they interact with the website multiple times throughout the day, such as browsing through products as well as beginning and completing the transaction.
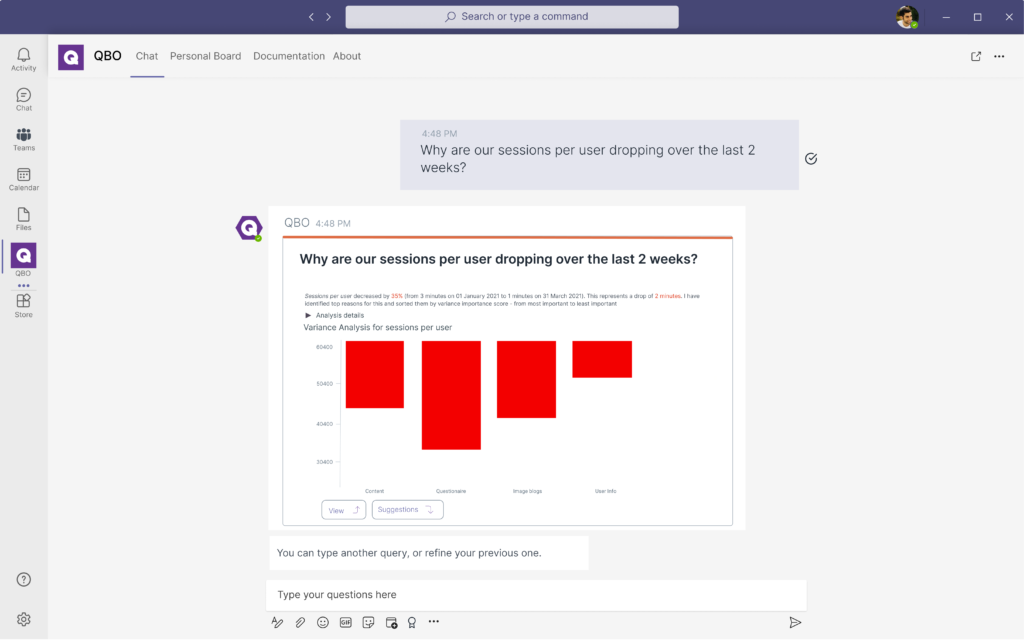
With business intelligence, you can analyze this metric in conjunction with your Users metric to draw relationships and gain deeper insight.
These questions can include:
“What is the average sessions per user over the last 12 months?”
“Why are our sessions per user dropping over the last 2 weeks?”
3. Traffic (Organic and Referral)
Your website’s organic traffic represents the number of users (or visitors) to your site that came from a search engine such as Google or Bing.
In contrast, your referral traffic is the number of visitors that have landed on your website or blog posts through 3rd party websites – such as other blog posts, forums, or web pages.
These two metrics are essential to track and monitor as they are good indicators of if your SEO campaign and content marketing efforts are paying off or not.
With business intelligence, you will be able to analyze these metrics at your fingertips by asking questions such as:
“What percentage of my overall traffic growth over the last 3 months came from organic sources?”
“Is my referral traffic growing faster than my organic traffic over the last year?”
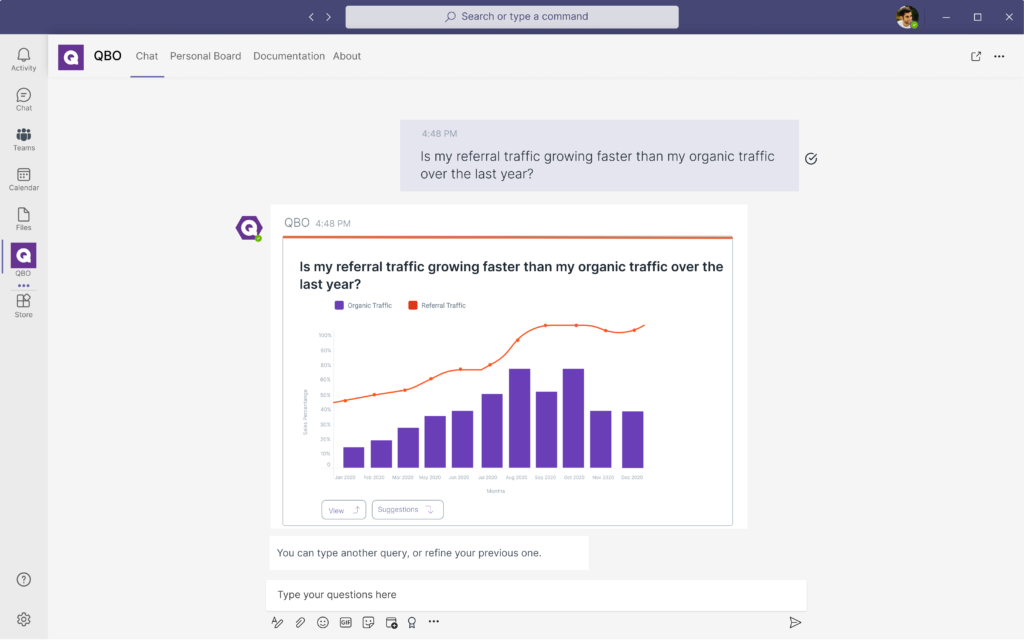
This helps you to better understand if your content marketing strategies from blogging or guest posting are going in the right direction.
4. Bounce Rate
Your bounce rate is an engagement metric that showcases the percentage of visitors who left your site without venturing deeper in.
Google defines the bounce rate as the single-page sessions divided by all sessions.
To access bounce rate in Google Analytics, simply head to Audience > Overview.
While a high bounce rate is generally not preferable, it will depend on the particular page type the bounce is happening. A higher bounce rate is more acceptable for informational content such as blog posts while you want your bounce rate to be lower on your transactional and service pages.
A high bounce rate also highlights to Google that either your content is not relevant or your website’s user experience is flawed – both of which can negatively impact your search rankings.
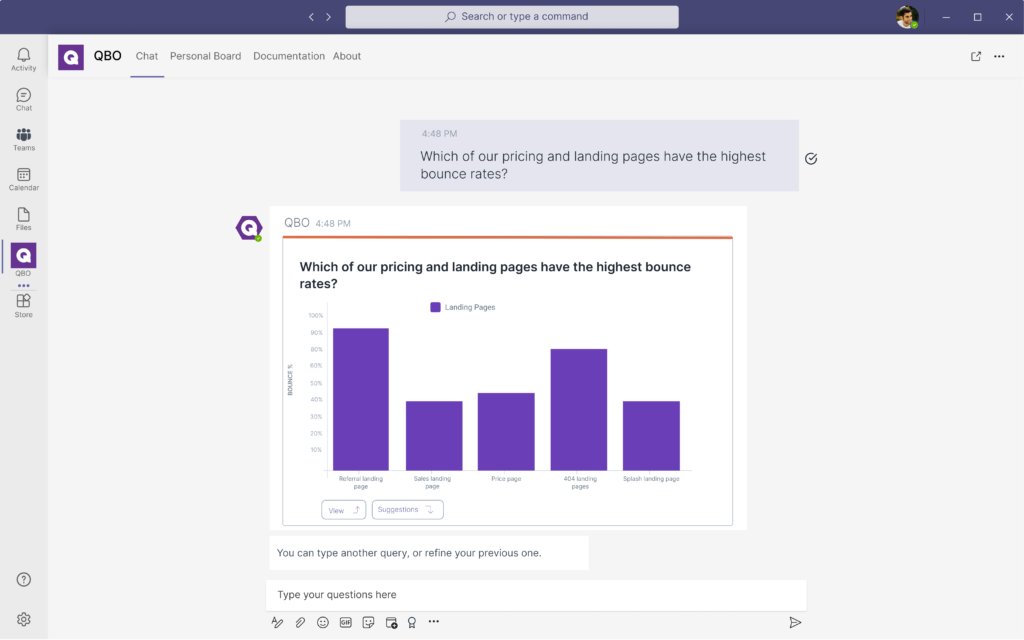
With business intelligence, you will be able to dive deeper into your bounce rate data and ask questions such as:
“Which of our pricing and landing pages have the highest bounce rates?”
To gain more accurate insights for better data-driven optimization.
5. Average Session Duration
The average session duration metric lets you know how long your visitors (or users) are staying on your website before they leave.
It is essentially the total duration of all your sessions divided by the total number of sessions in the time period.
To access the average session duration in Google Analytics, simply head to Audience > Overview and select your desired time period.
Tracking this metric allows you to know on the whole, how engaging your website as a whole is.
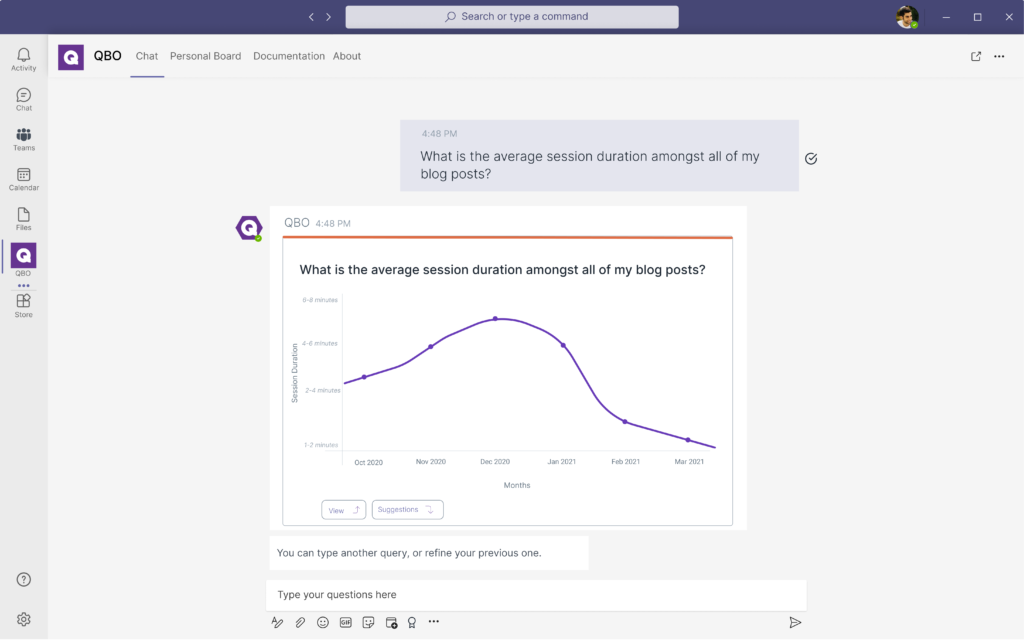
With business intelligence, you can gain better insights into each category of pages on your website by refining the queries:
“What is the average session duration amongst all of my blog posts?”
“What is the average session duration of our pages with the highest bounce rate?”
This will allow you to identify key areas to optimize such as your content, call-to-actions, and user experience.
6. Average Time On Page
Your average time on page measures how long your user spends on a single page which is a clear indicator of if the content is engaging well with your visitor.
To access this metric in Google Analytics, simply head to Behavior > Site Content > All Pages.
For example, if your case study pages have a low average time on page, this indicates that there are areas you will need to improve on – such as adding more visuals, infographics, or video testimonials to better retain their attention.
However, this time will vary depending on the type of pages such as blog posts, landing pages, and product pages.
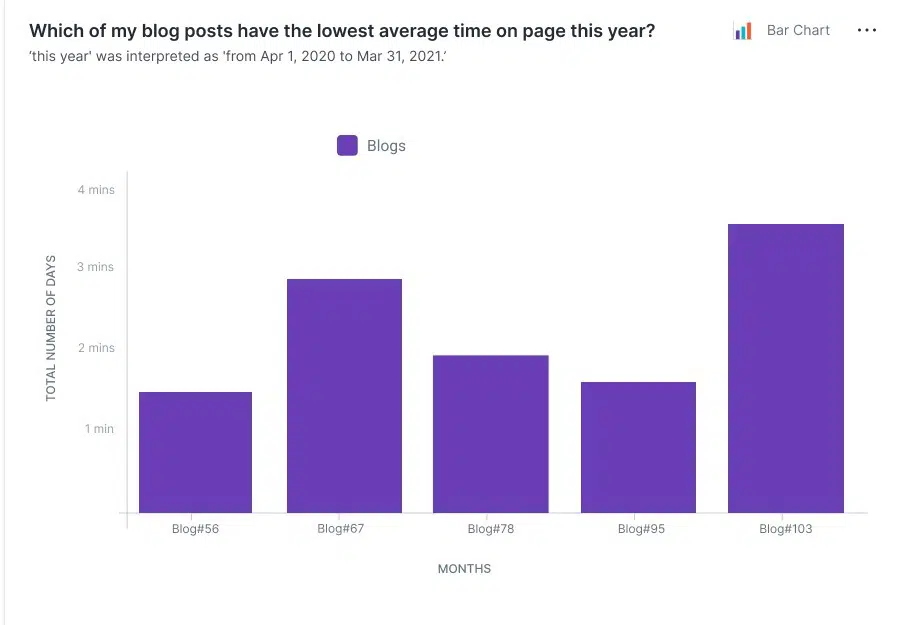
With business intelligence, you will be able to drill deeper into the data and gain more insights by asking questions such as:
“What is the average time on page for all of our blog posts to date?”
“For our pages with the highest bounce rate, what is the average time on page?”
7. Pages Per Session
The pages per session metric highlights the number of pages a user views during a session.
Essentially, the greater the number of pages per session, the more engaged your users are with your website.
To access this metric, simply head to Audience > Overview.
Increasing the pages per session metric is key to get your visitors to learn more about your business, interact more with your brand and browse more of your products and services – ultimately leading to a greater chance of conversion.
You can boost this metric by making your user’s navigation experience easier with better UX and including pathways (such as interlinking between content) throughout your pages and blog posts.
8. Goal Completions
Your goal completions metric tells you the number of times your visitors complete a specific goal on your website.
Depending on your business, pre-defined goals, and specific pages, this could include:
- Visits to your product or service pages
- Signing up for an ebook
- Subscribing to your email list
- Signing up for a free trial of your product
- Direct sales
To access this metric, simply head to Conversions > Goals > Overview on the left navigation bar.
It is important to note that each type of conversion will be different from the other. Naturally, a sales conversion will be harder to achieve compared to visitors subscribing to your email list for free.
With the power of augmented analytics and business intelligence, you will be able to swiftly make direct goal completion comparisons in the same category for better insights by asking questions such as:
“Which of my resource pages have the lowest goal completions? “
And drill even further with follow-up questions that include:
“Of these, which have the lowest average time on page?”
Allowing you to prioritize the most important pages to optimize as well as diagnose what might be causing the lower conversions at the same time.
9. Top 10 Landing Pages
The top 10 landing pages let you know the exact pages that your users land on to enter your website.
To access this metric, simply head to Behavior > Site Content > Landing Pages.
These are the pages where they will first experience interacting with your business online.
Keeping track of these pages will help you better add navigation links and call-to-actions to key pages in your website that you want to divert the traffic to.
10. Exit Pages
Your exit pages highlight the last pages that your user views on your website before they end the session and leave.
To access this metric, simply head to Behavior > Site Content > Exit Pages.
By monitoring and keeping track of these pages, you can take steps to engage your readers further to keep them browsing through the rest of your site.
It is important to keep an eye out if any of your sales pages (and checkout pages if you are in eCommerce) ends up in the list of the exit pages.
That will highlight that there is an underlying issue, such as a poor call-to-action or offer that isn’t very compelling, that is preventing your visitors from continuing to make the purchase.

Access Deeper Insights With Through The Power Of Business Intelligence
While Google Analytics is a powerful tool to help you better understand your website performance, it isn’t very versatile when it comes to insights generation, especially in real-time.
That’s why at Unscrambl, we developed Qbo, an AI-powered conversational analytics BI tool, packed with powerful capabilities like QPacks that provide you with real-time alerts on the metrics that matter to you.
With Qbo, you will be able to harness the full power of your data and start fostering a data-driven culture across your organization, beyond just digital marketing.
Embark on a free 14-day trial and start making better data-driven decisions in your marketing campaigns.