7 Minutes
7 Instagram Metrics To Track & Analyze For Better Insights
Growing a subscriber base while fostering engagement with your followers is getting increasingly harder on Instagram, especially if you aren’t tracking the right metrics.
As a social media platform, it is easy to get lost in a myriad of vanity metrics and not focus on the right ones that will push your business forward.
Likes and comments are great, but are your efforts translating into targeted subscriber growth?
Unlike the more traditional platforms such as Google search, the baseline Instagram metrics are surface-level numbers that are captured at a specific moment in time.
You will need to analyze these metrics according to your context as well as establish benchmarks where meaningful comparisons can be made.
This will allow you to draw actionable insights to optimize your strategy & grow an engaged subscriber base.
Powering Greater Insights With Business Intelligence
As Instagram’s organic reach continues to decline year on year, marketers will have to stay on their toes with their content and distribution strategy.
From creating more engaging content to optimizing your hashtags and developing highly shareable Instagram stories, you will need data-driven insights at your fingertips to make these adjustments as swiftly as possible.
This is where business intelligence comes in.
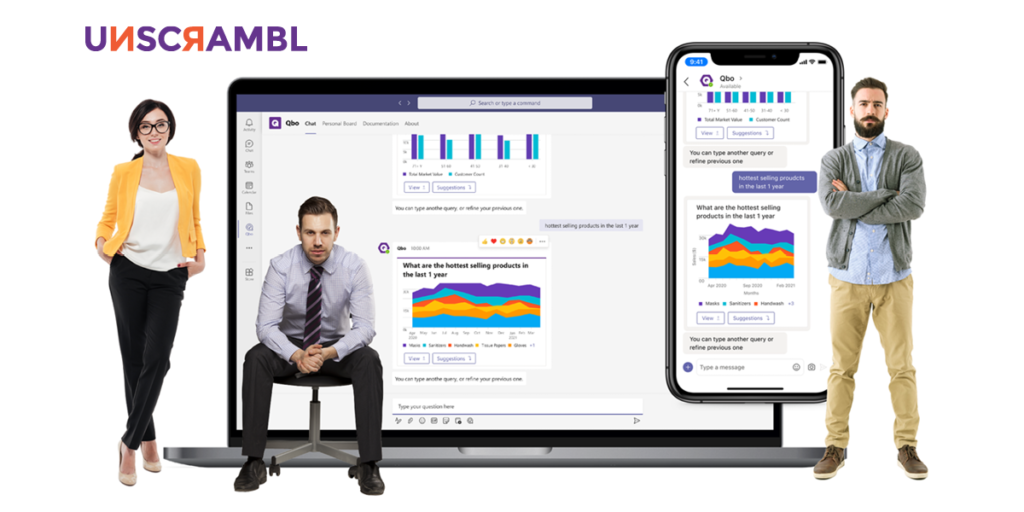
With Qbo, a business intelligence tool powered by conversational analytics, you will be able to draw deeper insights on-demand, allowing your marketing team to diagnose the issues facing your current strategy as well as the prescriptive actions that can be taken and double-down on what is working.
In this article, we will be taking you through the 7 Instagram metrics you must track and how you can utilize the power of augmented analytics to draw faster and deeper insights into your analytics data.

The Top 7 Instagram Metrics To Track & Analyze
1. Follower Growth Rate
Your follower growth rate is one of the best indicators of whether your business is growing on Instagram – it is a direct measure of how effective your content and marketing strategy is as a whole.
Done manually, you can calculate your follower growth rate with this equation:
Follower Growth Rate = [(Followers at the start of Time Period A – Followers at the start of Time Period B) / (Followers at the start of Time Period A)] X 100
While having a large number of followers might be good you want to see consistent growth, especially as the number rises. If your follower growth rate plateaus, it is time to recheck elements of your content strategy.
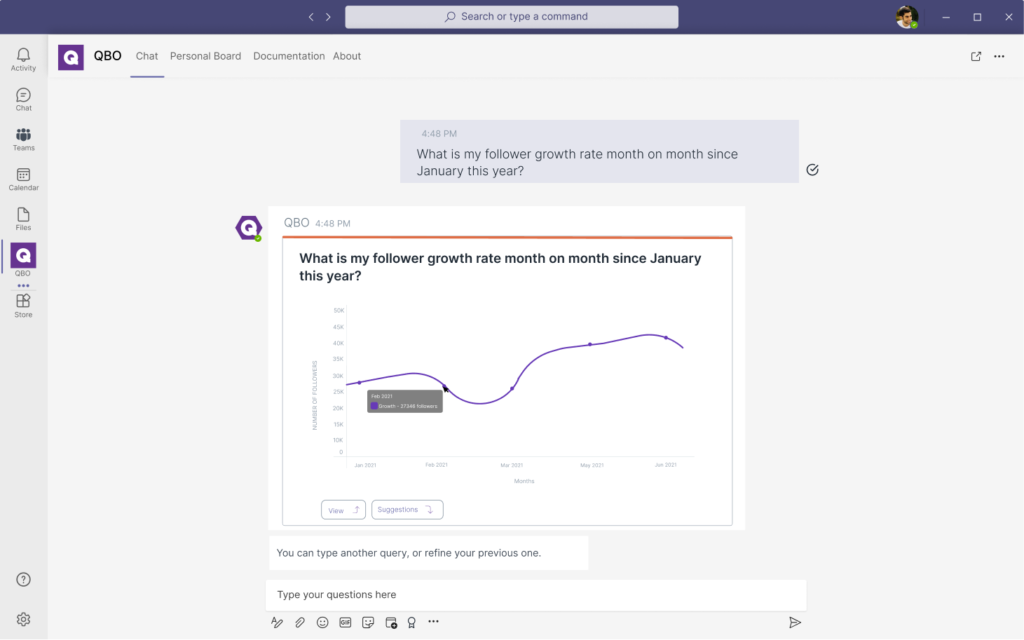
With Qbo, you will be able to track this metric instantaneously and dive into the data to gain deeper insights by asking questions such as:
“What is my follower growth rate month on month since January this year?”

“What type of content should we produce to increase our follower growth rate?”
2. Post Engagement
Your post engagement is a measure of how effective and compelling your content is to your audience that they are responding to.
An engagement with your posts includes comments, likes, saving, and sharing your content with their network.
While your post engagement rate will change as the number of followers you gain changes, it is useful to track this metric to understand the quality of your content.
With business intelligence, you can take this one step further and analyze the relationships between your engagement types to intentionally tweak your content strategy further.
By asking questions such as:
“Which type of posts drive higher shares compared to just likes?”
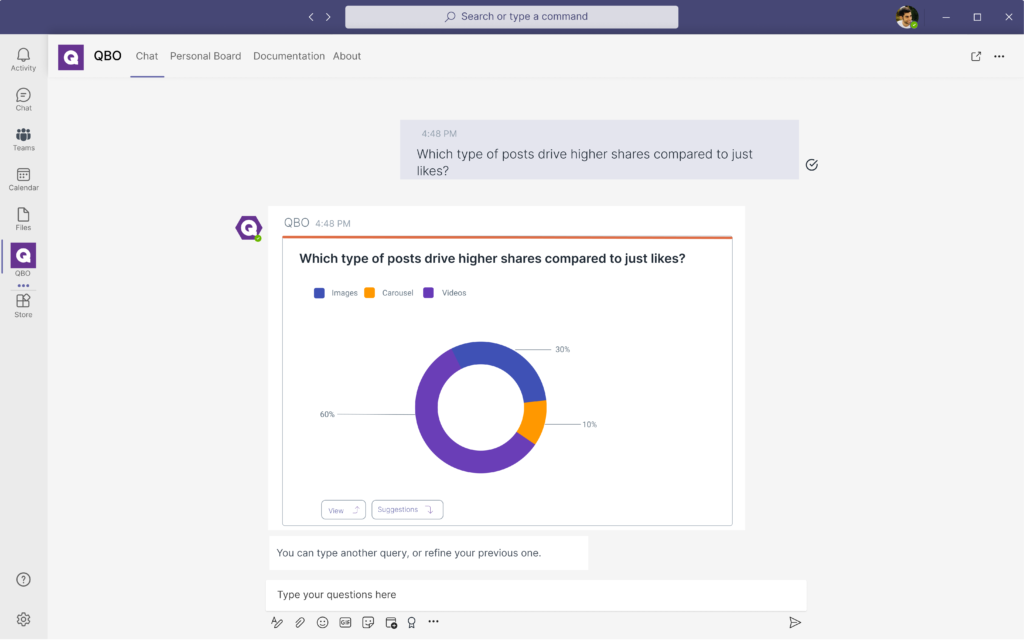
You will be able to narrow down the types of content you should develop to boost the specific type of engagement you desire.
3. Engagement Per Follower
A high engagement doesn’t just highlight that your content is compelling, it also sends a signal to Instagram’s algorithm that your content is engaging – spurring them to show it to more of your organic followers.
With a high engagement per follower rate, you’ll also increase the chances of being featured and seen on the much-coveted Explore page, increasing your reach and odds of attracting more followers.
To calculate your engagement per follower metric, simply sum up your total engagements (likes, shares, comments, and saves) and divide them by the number of followers you have during the time period where you’re measuring.
A low engagement rate would mean your content is likely not resonating and connecting with your followers. It could mean the timing of your posts is flawed, the wrong hashtags are being used or your call-to-actions are weak.
With Qbo, you can ask questions directly to your Instagram data to drill deeper into your engagement rate data:
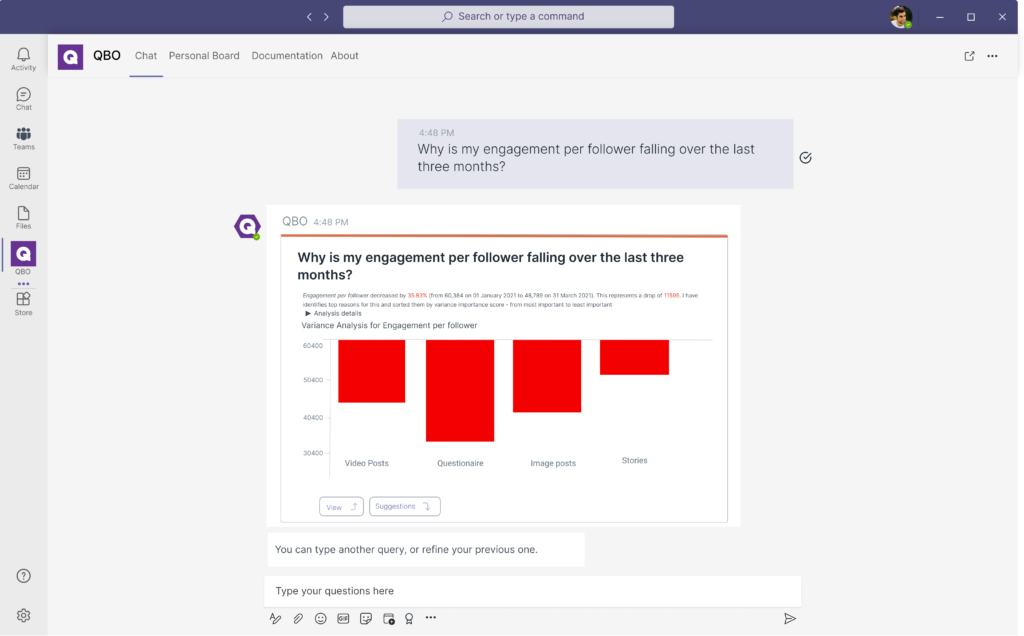
“Why is my engagement per follower falling over the last three months?”

“How do I boost my engagement per follower when it comes to comments and shares?”
In addition, with Qbo’s capability, QPacks, you will be able to pick up important changes in this key metric with pre-programmed benchmarks.
For example, if your engagement per follower rate drops below a certain level, you will be informed with proactive alerts to allow you to take corrective actions.
4. Reach
Your reach is an important metric that essentially tells you the total number of people who have seen your post and is a direct correlation to the amount of brand awareness you are garnering from your content.
Embarking on content campaigns to increase an account’s reach is common, hence analyzing this metric is essential to ensure your advertising & content creation dollars are spent wisely.
Monitoring your reach is more accurate compared to impressions. If one person views your post 5 times, it is considered as 5 impressions, however, it is counted as only 1 towards your reach.
Monitoring your reach allows you to know the number of unique views your posts have garnered and can be analyzed in conjunction with other metrics to gain a clearer picture of your content’s performance.
With Qbo, you can ask insightful questions such as:
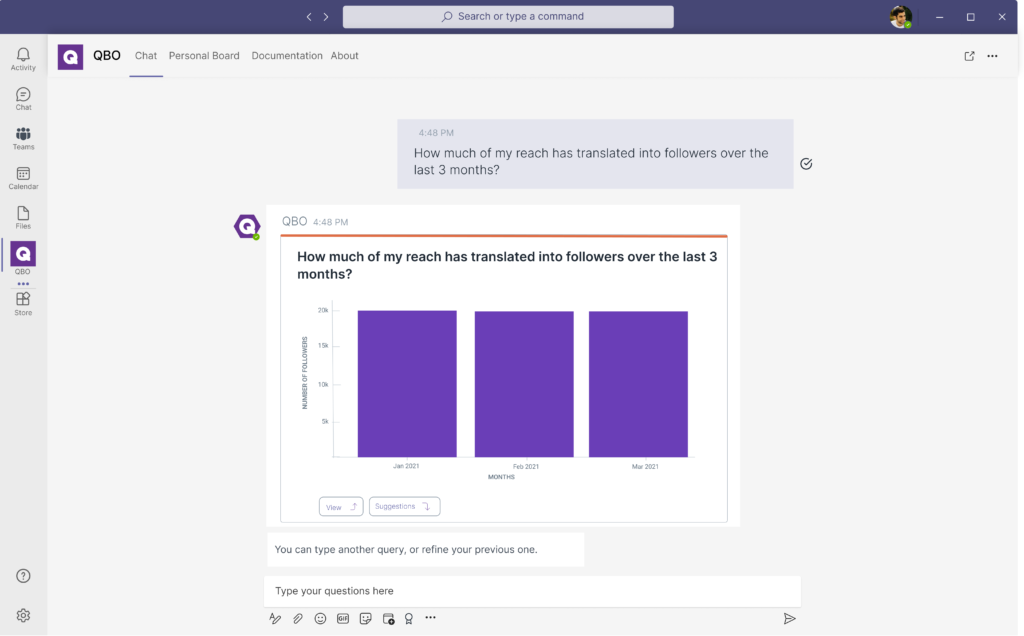
“How much of my reach has translated into followers over the last 3 months?”

“What percentage of reach came from the explore page for my last 50 posts?”
5. Website Referral Traffic
While keeping track of your follower count is important, it is also important to keep track of the amount of referral traffic you are getting from Instagram.
This can be traffic from your Instagram bio’s link to the links within each of your Instagram stories.
You can easily check this through Google Analytics under the sources of your traffic acquisition.
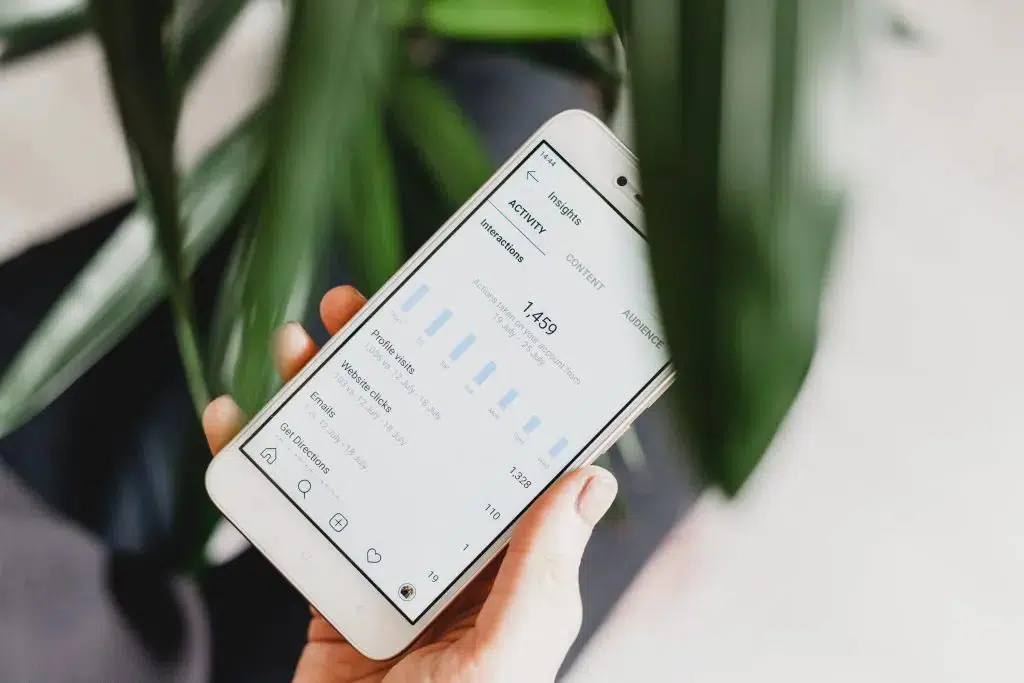
While Instagram’s insights will share with you data such as website clicks, it is rather inconvenient to manually analyze each individual post.
With business intelligence, you can comprehensively analyze the sources of your Instagram traffic to help you better optimize your strategy by asking questions such as:
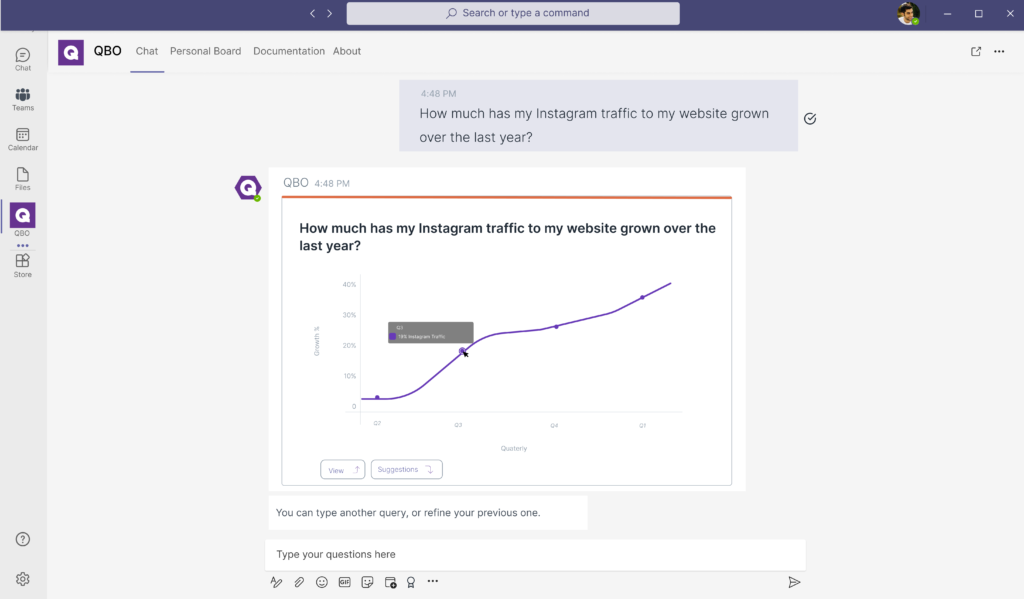
“What percentage of actions translates into website clicks for my posts over the last year?”

“How much has my Instagram traffic to my website grown over the last year?”
6. Instagram Stories Engagement
Most marketers only keep track of their Instagram stories view count – that isn’t enough to make insightful or impactful decisions.
While details such as the taps forward, taps back, and exits have value, it is better to measure two specific metrics that will determine if your stories are engaging or not.
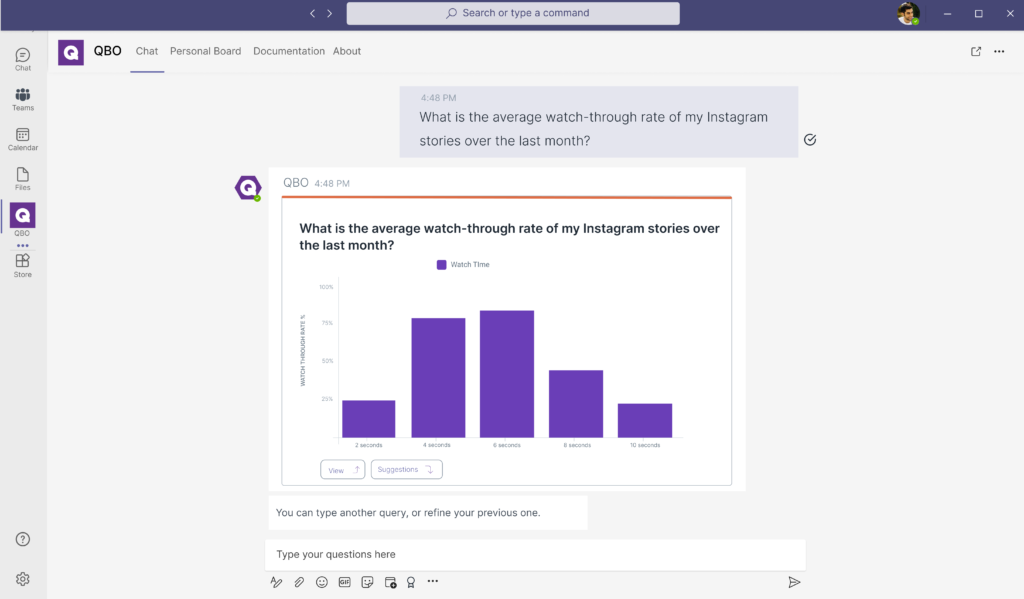
A) The Watch-Through Rate
The watch-through rate measures the percentage of viewers who have fully gone through your stories from the start to the end.
This is particularly important when you are creating content campaigns where there are multiple story slides present. You can calculate it with this equation:
Watch through rate = (The views on your final story / The views on your first story) x 100
B) The Bounce Rate
The bounce rate measures how many people drop off after your first story and is a clear indication if your stories are engaging enough or not.
A high bounce rate indicates your story series’ narratives aren’t in line with your viewer’s expectations or there is an issue with the content itself.
You can calculate your bounce rate with this equation:
Bounce rate = (The views on your first story / The views on your final) x 100
Alternatively, you can simply ask Qbo to help you analyze your data and deliver to you the metrics and more.
“Which of my Instagram stories have the biggest bounce rate and on which specific story is the bounce rate the highest?”

“What is the average watch-through rate of my Instagram stories over the last month?”
7. Sales Generated
Tracking your sales amount from Instagram is perhaps the ultimate metric that will determine if your campaigns and marketing strategies are successful or not.
Setting this up will require you to go into your Google Analytics and set your goal settings and define your referral traffic as Instagram and the goal as sales.
This will allow you to track the sales you get directly from Instagram.
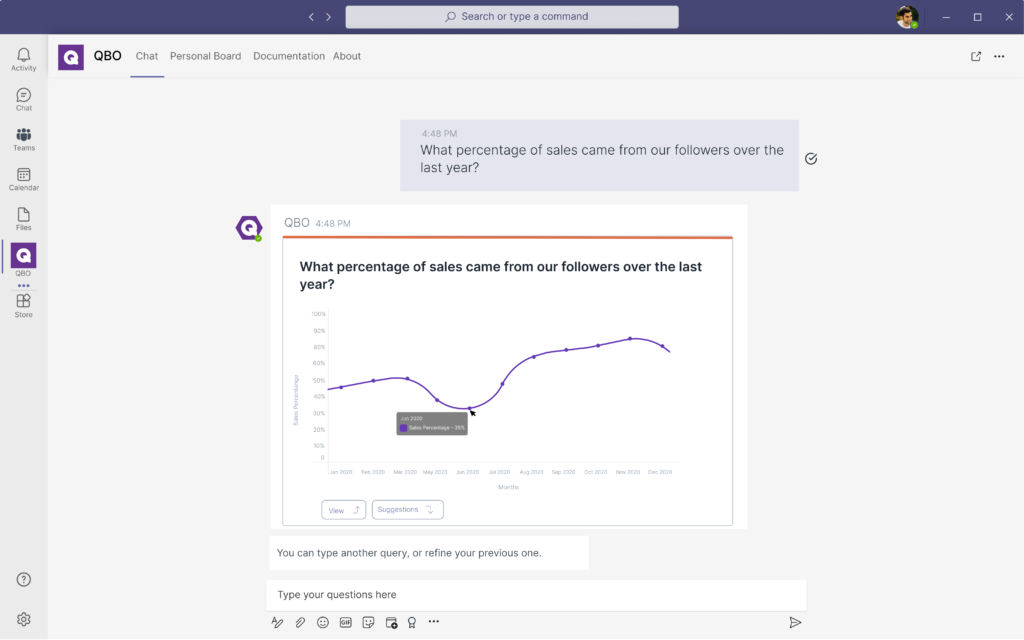
With business intelligence, you will be able to dive deeper and gain insights, by asking questions to your data such as:
“Which of our Instagram stories resulted in the most sales generated over the last 3 months?”

“What percentage of sales came from our followers over the last year?”
Unlock Deeper Insights From Your Instagram Metrics With Business Intelligence
At Unscrambl, we built Qbo, an business intelligence tool powered by conversational analytics to help marketers better access and analyze their data.
Users will be able to simply ask questions to their data and gain insights on-demand to better diagnose their marketing performance for swifter corrective action.
As competition ramps up and Instagram’s algorithm continually evolves, smart marketers have to harness the power of their data through data analytics to stay ahead.
Start unlocking true data democratization with Qbo today and start building a data-driven culture for better data-driven decision-making.
Embark on a free 14-trial of Qbo and see for yourself how easy it is to gain actionable insights from your Instagram data.