 7 Minutes

8 SEM Metrics To Optimize For Greater Campaign ROI With Augmented Analytics
Running a successful pay-per-click (PPC) campaign on Google requires constant optimization along the way to consistently generate profitable business results.
Unlike SEO, search engine marketing (SEM) is a pay-to-play channel where you could lose your ad dollars quickly if your strategy isn’t on-point and consistently tweaked.
Marketers need to prevent this by tracking key SEM metrics to maximize their investment by not only targeting the right keywords but also lowering the cost of acquiring customers.
In this article, we will be taking you through the essential SEM metrics you should be tracking and how to utilize augmented analytics to derive actionable insights for more accurate optimizations.
The 8 SEM Metrics To Track, Analyze & Optimize
1. Click-Through Rate (CTR)
The click-through rate showcases how often viewers of your ad end up clicking it.
It is a valuable metric that highlights how relevant and compelling your ad is to your target audience.
While you’d want a higher click-through rate throughout your SEM campaign, changes in search intent and your competitor’s ads might lower your CTR as time passes.
Optimizing your CTR is essential for a higher Quality Score, which could result in you paying more for an ad position.
A good way to track your CTR is both on the individual ad as well as the campaigns and ad groups to see if a low CTR persists throughout or if it is just an isolated case.
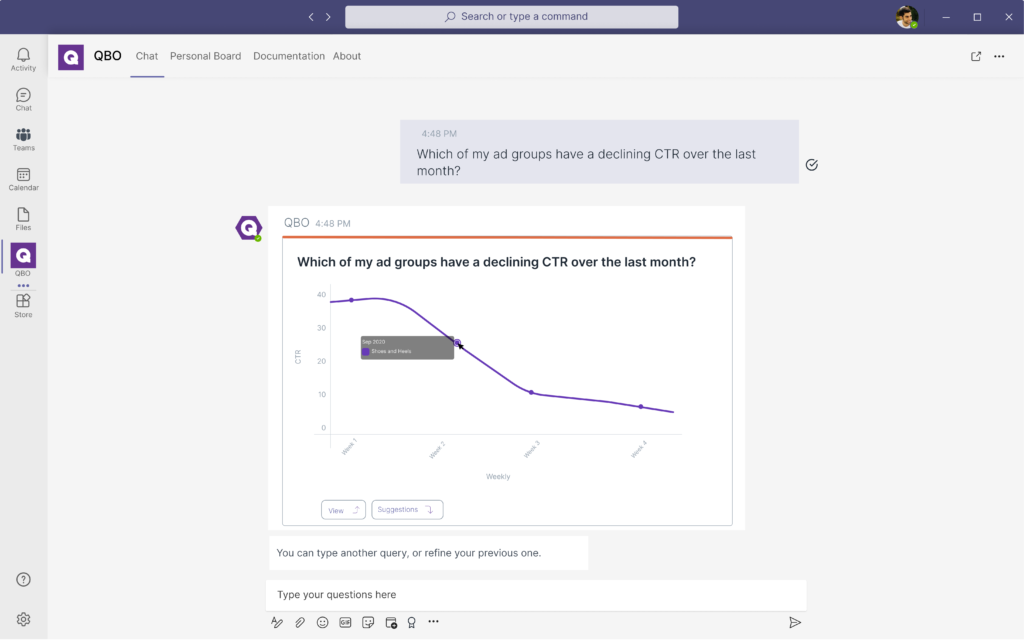
With augmented analytics, you can dive deeper into your click-through rates and ask insightful questions to your data such as:
“Which of my ad groups have a declining CTR over the last month?”

“Compared to the average campaign CTR, which ads have the lowest CTR?”
This will allow you to pinpoint ads that are underperforming and take faster corrective action such as including more compelling call-to-actions and details that highlight urgency such as limited-time offers.
2. Conversion Rate
The conversion rate is a measure of how compelling, relevant and persuasive your landing pages are after your prospect clicks through from your ads.
A low conversion rate could indicate a few potential issues that you will have to correct. These include:
- A disconnect of relevancy & expectations between your ads and landing pages
- Not targeting the right audience at the right stage of your sales funnel
- Issues with your landing page’s design, user experience, or copy
- Weak call to actions with complicated forms
- A lack of social proof such as testimonials
With augmented analytics, you can ask questions to quickly identify ads that will need to be optimized:
“Which ad groups are currently seeing conversion rates drop over the last four weeks?”

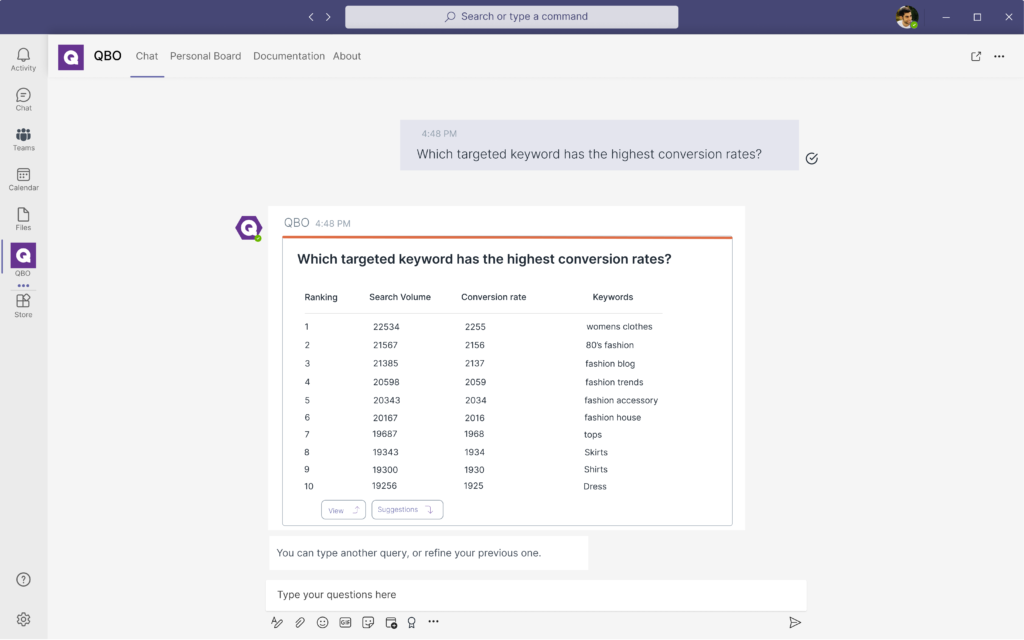
“Which targeted keyword has the highest conversion rates?”
While the average conversion rates across all industries are 3.75% for AdWords and 0.77% for display ads (2018), it is also key to benchmark your conversion rates according to your previous campaigns.
If there is a trend of declining conversion rates, then it is a clear signal that corrective action is necessary.
3. Cost Per Click (CPC)
The cost per click is perhaps the most widely tracked and monitored metric in search engine marketing.
It is essentially how much you are paying for a single click on your ad campaigns.
CPC will fluctuate throughout any given time period depending on the demand to advertise for that given keyword as well as the quality score of your competitors’ ads.
Monitoring your CPC is crucial to ensure your ad campaigns stay on budget as well as keeping your cost per acquisition down.
With augmented analytics, you can comprehensively analyze your SEM data to identify ads that are becoming too expensive by asking questions including:
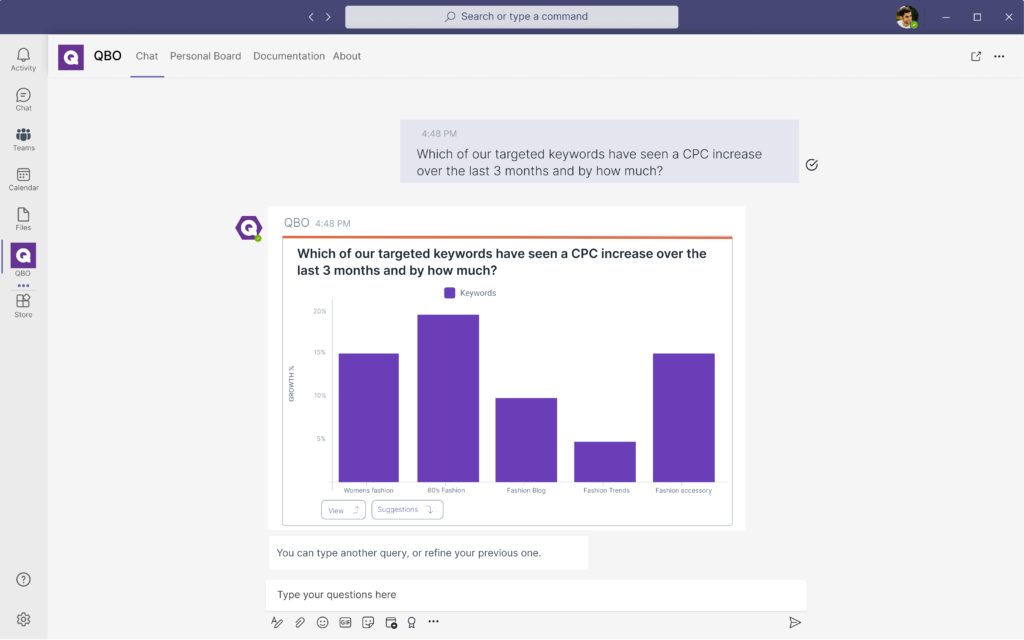
“Which of our targeted keywords have seen a CPC increase over the last 3 months and by how much?”

“What is the cost per click for our ads with the lowest and highest conversion rates?”
These insights will allow you to better understand how much you are paying in your campaigns and the type of corrective action to take – from choosing long-tail keywords to better scheduling of your ads when your customers are most active.
4. Quality Score
The quality score metric is a number between 1 to 10 that Google Adwords assigns to your ad. It is a measurement of how relevant your ad is and will perform when you bid on keywords.
Essentially, the higher your quality score, the lower you will pay per click and the more money you will save on your ad campaigns. This is one metric that you’d want to optimize and this can be done by:
- Increasing your click-through rates
- Improving the relevancy of your ad with your landing page
- Boost the user experience & conversion rates of your landing page
- Grouping your keywords together
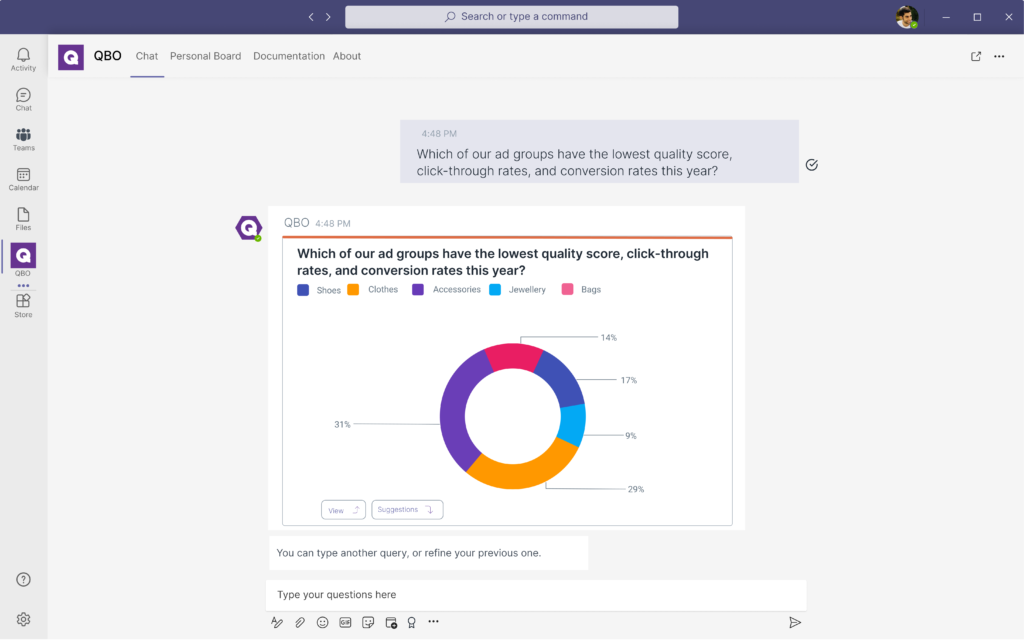
By using business intelligence powered by augmented analytics, you will be able to identify key areas that aren’t being optimized in your ad groups through queries including:
“Which of our ad groups have the lowest quality score, click-through rates, and conversion rates?”
5. Impressions Share
The impressions share is the percentage of impressions your ads receive versus the total number of possible impressions that your ads could get.
Impressions happen every time your ads are viewed, most commonly after a search of your targeted keyword is conducted.
The impressions share metric is a good indicator of the potential audience reach of your ads and showcases how much more you can scale your campaigns if you decide to increase your bid or your total advertising budget.
This is a good metric to monitor to see if there are opportunities to ramp up your customer acquisition efforts on a certain set of keywords, especially if conversion rates are good and customer acquisition is profitable.
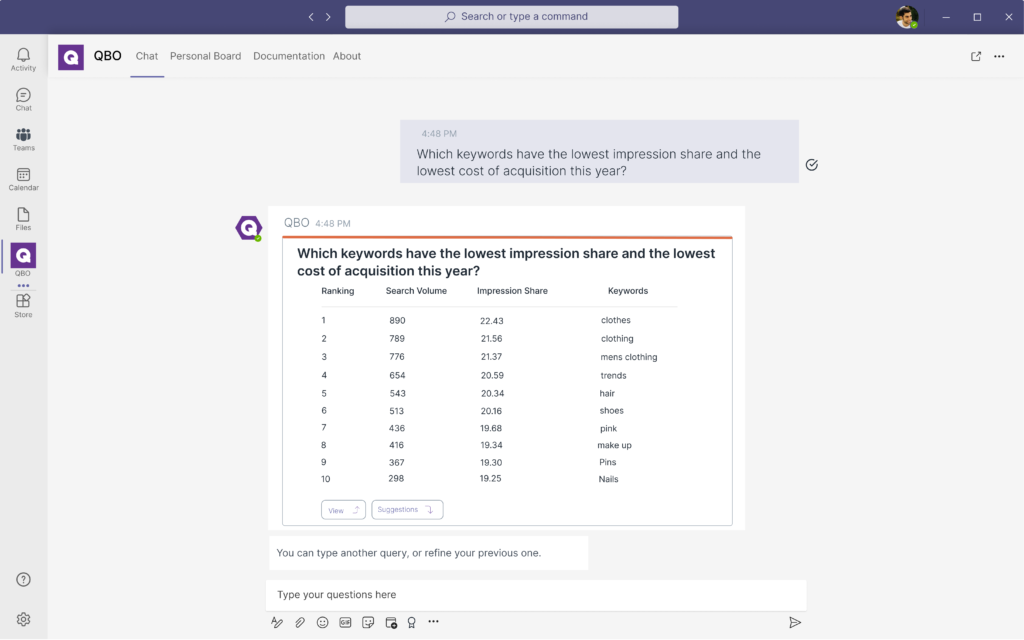
Additionally, with business intelligence, you can ask insightful questions such as:
“Which keywords have the lowest impression share and the lowest cost of acquisition?”
This allows you to instantaneously pinpoint valuable opportunities to scale your ads and double down on what is already winning.
6. Cost Per Action (CPA)
Your cost per action highlights the average amount you have spent to acquire a conversion from your ad.
A higher CPA indicates that you are paying more to get a conversion (subscriber, lead, or sale).
Depending on your industry and where you are in your ad campaigns, you might want to focus on targeting keywords on either CPA or CPC.
CPC is a good option for advertisers in the process of optimizing their PPC profile (such as click-through rates and conversions) to earn a higher quality score that will ultimately drive down advertising costs.
CPA, on the other hand, is a good option if you desire to have more control over your campaign’s return on investment.
By monitoring your CPA, you will be able to determine which marketing channels and ad groups are delivering revenue and eliminate the ones that don’t bring in business.
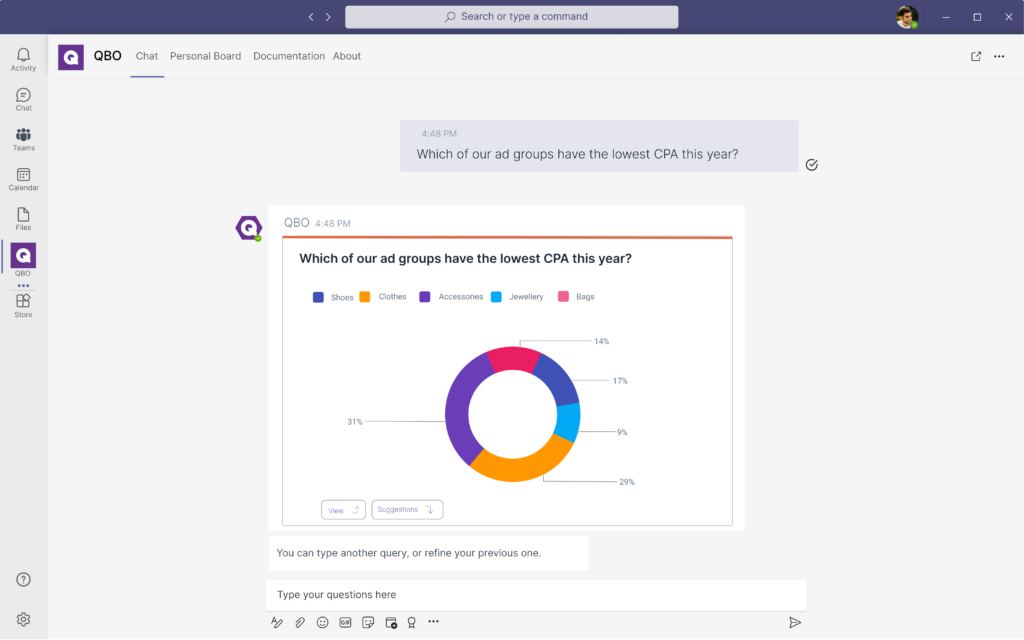
This can be done by simply asking your BI tool:
“Which of our ad groups have the lowest CPA.”
7. Customer Lifetime Value (CLV)
By measuring the customer lifetime value, you will be able to determine how much revenue you can expect to earn from each customer.
This is important as it will allow you to place an expected dollar figure to compare with your customer cost of acquisition (CPA in many cases).
If you have a higher CLV, you’ll be able to spend more on your ads and grab more market share. Conversely, if your CLV is marginally higher, you can use that information to consider swapping your product on offer for one with a higher margin.
Calculating your CLV can get cumbersome and this is one metric you’ll need on hand instantly.
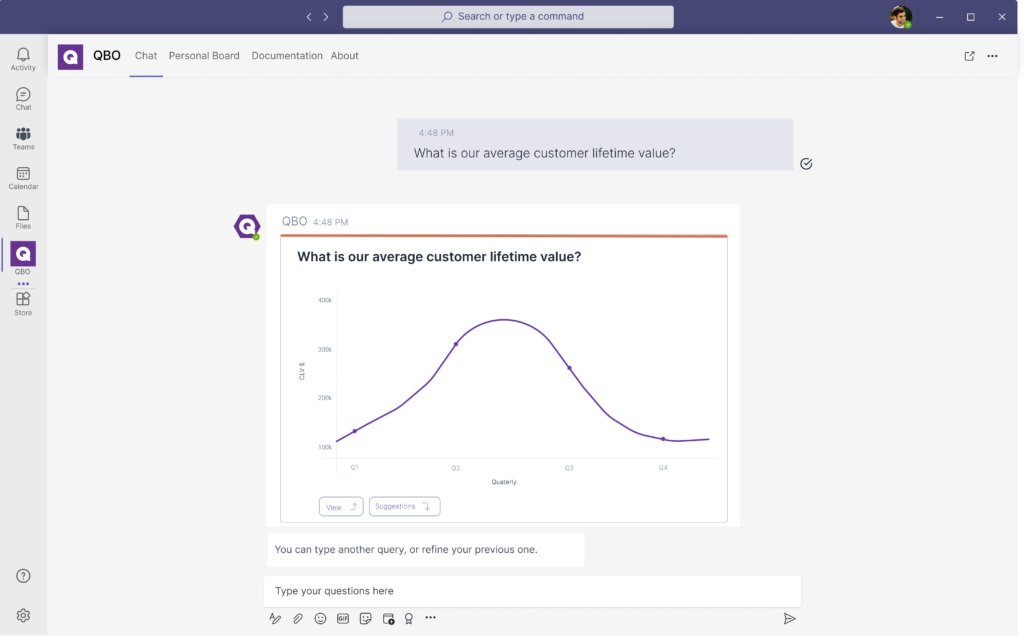
With business intelligence, you can easily obtain this metric by asking:
“What is our average customer lifetime value?”

BI tools such as Qbo, will analyze your organization’s data to return this insight that you then use to determine if it is worth it to scale up your ad spend or if it is better to prioritize increasing the CLV itself through customer loyalty programs and better customer service.
8. Return On Ad Spend (ROAS)
Your return on ad spend is a metric that tells you how effective and efficient your ad campaigns are.
It is calculated by taking your revenue earned and dividing it by the ad spend.
Ideally, you’d want to invest further in keywords and ad campaigns that have a high ROAS.
When it comes to maximizing your revenue earned, your ROAS is a better metric to track and utilize compared to CPA. This is because it takes into account the bigger picture of how much revenue each conversion is generating while the CPA only takes into consideration the raw number of conversions and not its quality.
With business intelligence, you can drill even further and gain insight into your return on investment (ROI) by asking:
“What is the ROI of the campaigns with the highest return on ad spend?”
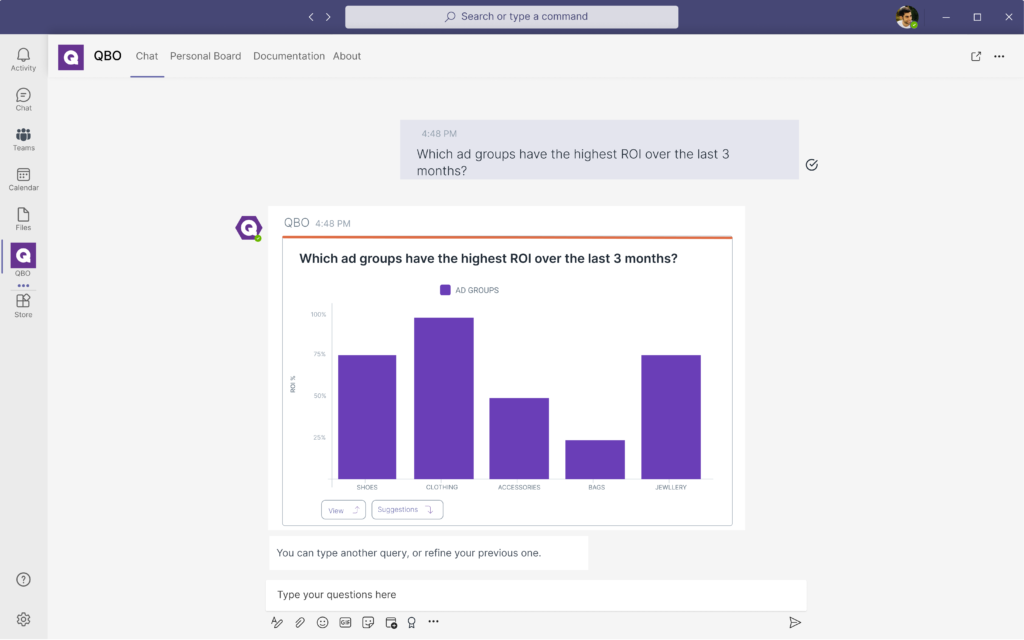
“Which ad groups have the highest ROI over the last 3 months?”

Through augmented analytics, Qbo will comprehensively analyze the key costs beyond your ad spend to help you better understand your profit margins and which campaigns
With insights such as this, you’ll be able to be better poised to ensure that your campaigns are profitable and sustainable after factoring in the additional cost of production & labor.
Unlock Deeper Insights & Optimize Your SEM Strategies With Qbo
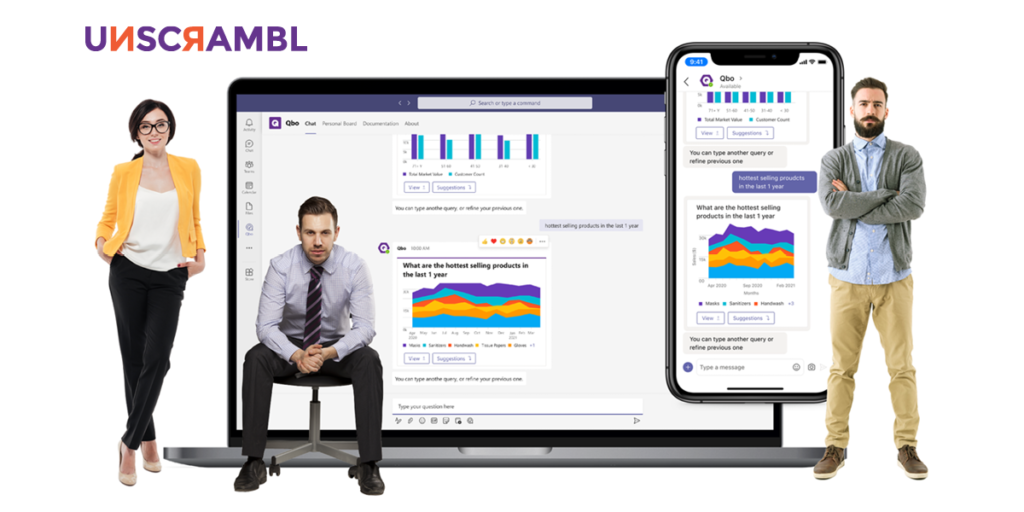
At Unscrambl, we built Qbo, a business intelligence tool powered by conversational analytics, allowing users to simply ask questions to their data for instantaneous insights.
With our QPacks capability, you will be able to pre-program applications of the analytics to pick up important changes in your metrics.
For example, if the click-through rates of your campaigns were to suddenly tank or your CPC for a set of keywords were to rise substantially, Qbo will provide you with proactive alerts.
This allows you to immediately identify the ads that are underperforming or keywords becoming too expensive to bid on going forward, helping you to swiftly optimize your targeting strategies while protecting your budget.
With Qbo, you can unlock true data democratization across your organization and start building a data-driven culture for better decision making.
Embark on a free 14-day trial today and harness the full power of your SEM data for more profitable campaigns.
