8 Minutes

YouTube Analytics For The Augmented Consumer: 10 Metrics To Consistently Measure & Analyze
YouTube is fast becoming a mainstream content marketing channel for brands big and small, with that comes increased competition.
In fact, over 1 billion hours of YouTube videos are being consumed every day – more than Netflix & Facebook videos put together!
Marketers will have to ensure every video uploaded has the best odds of engaging their audience, pleasing current subscribers as well as ultimately driving business to their products and services.
Creating the right type of content has never been more crucial.
To accomplish this and win in the YouTube game, you will have to learn how to measure YouTube success the right way and that begins with monitoring and analyzing the right metrics.
Thankfully, together with the power of business intelligence, the augmented consumer will be able to dive deep into their YouTube data and gain insights into the best types of content that resonates best with their audience.
In this article, we will be going through the 10 YouTube analytics metrics to track and how to use business intelligence to gain more actionable insights to supercharge your channel’s growth!

The Top 10 YouTube Analytics Metrics To Monitor & Analyze
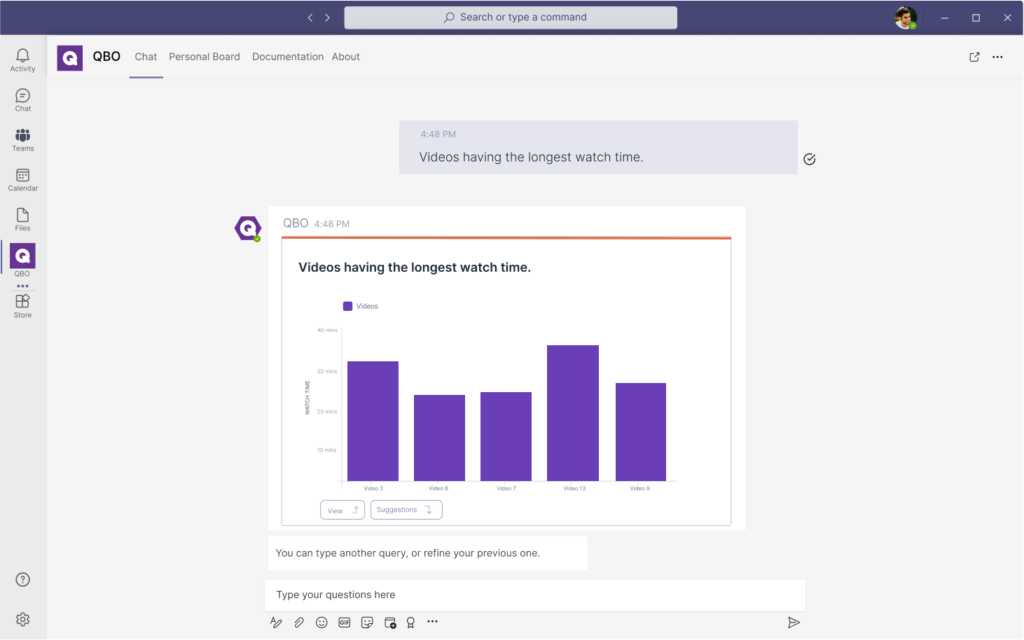
1. Watch Time
The watch time is the total amount of minutes viewers have spent watching your videos.
This standalone metric is a basic but good indicator of how well your content is performing – if it is engaging enough for your reader to watch from start to end.
While the number of views on your videos is important, your watch time holds more value in the YouTube algorithm which prioritizes videos that have a longer watch time, pushing them further out to more viewers in the recommended feed.
With business intelligence, you can ask insightful questions to your data to better understand the content that are engaging to your audience:
“Which of our videos have the longest watch time over the last 12 months?”
“Which of our most viewed videos have the shortest watch time?”
This allows you to better analyze the content of your videos, notice the trends and uncover commonalities in your content that are well-received by your viewers.
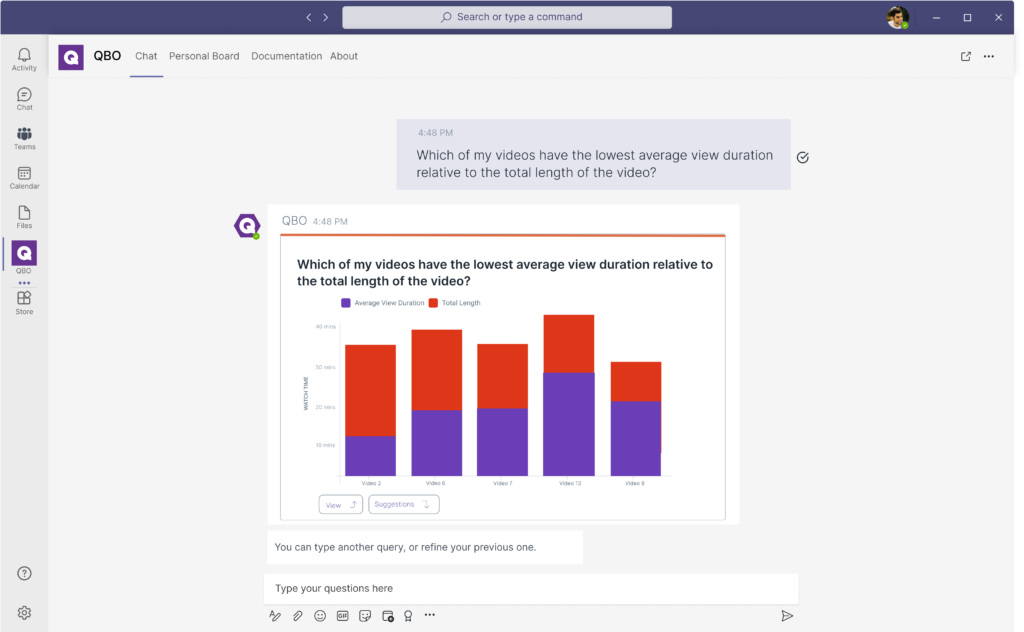
2. Average View Duration
The average view duration metric is the total watch time of your video divided by the number of video plays.
This metric is important to track as it is a more accurate representation of how engaging and compelling your video is.
If your video has a duration of 10 minutes and the average view duration is under 3 minutes, chances are you have a narrative problem that isn’t compelling. However, if the average view duration is less than 20 seconds, you will know that your introduction is either too long or not engaging enough.
With business intelligence, you can do a global sweep of all your videos are quickly pinpoint the ones that are objectively underperforming by simply asking to your tool:
“Which of my videos have the lowest average view duration relative to the total length of the video?”
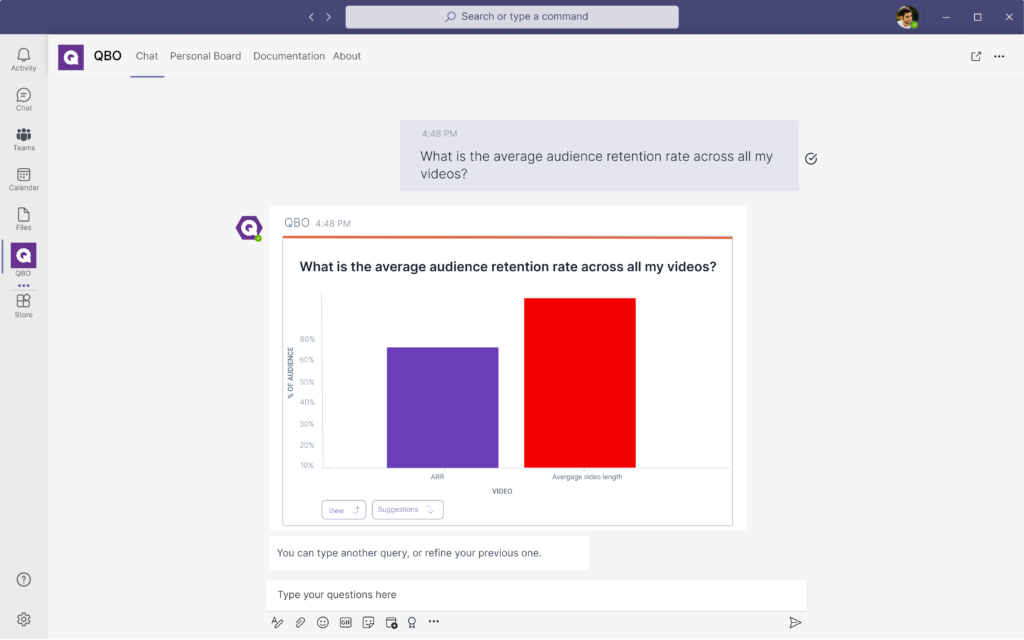
3. Audience Retention Rate
Your audience retention rate highlights the percentage of viewers who watch and leave your video across at different points in time across the duration of your video.
In addition, viewing your audience retention graph will allow you to find out where the greatest drop of viewers happens during your video.
This allows you to pinpoint issues with your content and helps you take corrective action for future videos. This can include more compelling content, reducing your overall duration, or incorporating call to actions to direct their attention before the drop-off.
However, there are drawbacks. You will only be able to analyze the retention rate one video at a time without any insights on commonalities that might exist across your historical videos.
Thankfully, with the help of business intelligence, you can comprehensively analyze your audience retention rate across your video collection by asking questions such as:
“What is the average audience retention rate across all my videos?”
“When does the biggest drop of audience retention occur in my last ten videos?”
This helps you identify if there are patterns in your content creation strategy that need to be addressed if it is a one-off issue for a particular video or format.
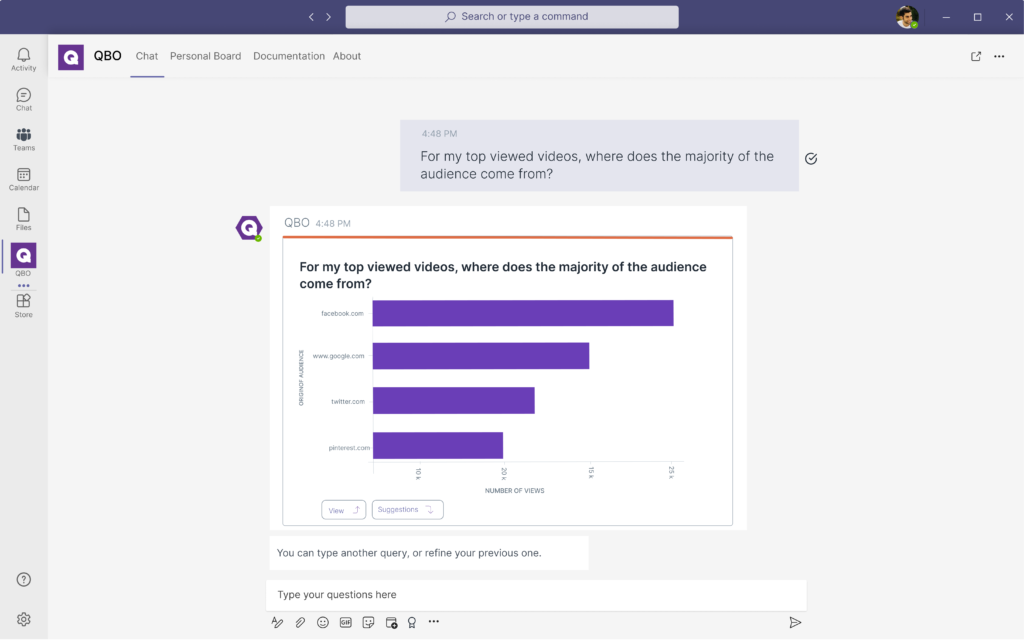
4. Traffic Sources
Traffic sources is an important metric that lets you know where your viewers are coming from.
This includes a plethora of sources from YouTube Ads and suggested videos to YouTube search queries and in-video end screens.
Understanding your traffic sources is particularly important to refine your content strategy, especially if you are incorporating paid advertising to accelerate your channel’s reach – you’ll want to account for your financial investment!
With business intelligence, you can dive deep into your analytics data and understand the traffic sources in a variety of situations:
“For my top viewed videos, where does the majority of the audience come from?”
“Which of my traffic sources is seeing the most growth for the last 3 months?”
These insights will allow you to understand if your content strategies are working and how to potentially pivot if they aren’t.
5. Engagements (Shares, Comments, Likes)
There are three key engagement metrics on YouTube that every marketer will have to monitor closely. They are the shares, comments, and likes (or dislikes) on a video.
These metrics highlight the qualitative nature of your video and how your viewers perceive the value of your content. The higher quality and more on-point your content is, the more shares, comments, and likes it will garner.
This is critical as YouTube’s algorithm favors videos with high engagement and will dramatically increase the odds of your content being ranked higher in the search bar and appearing in the recommended or suggested video feed of new viewers.
Utilizing business intelligence, you’ll be able to gain even more qualitative insights into your engagement metrics by asking questions such as:
“Which of my videos have the greatest dislikes to likes ratio?”
“Which of my videos have the most comments and shares over the last 3 months?”
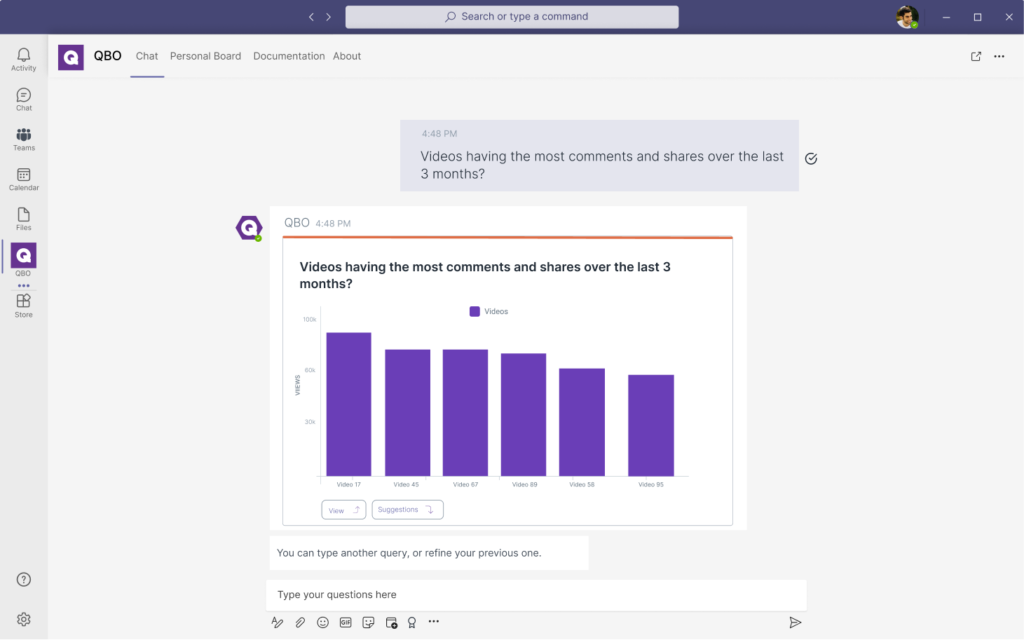
This allows you to better analyze your content to see what works and what doesn’t for better optimization.
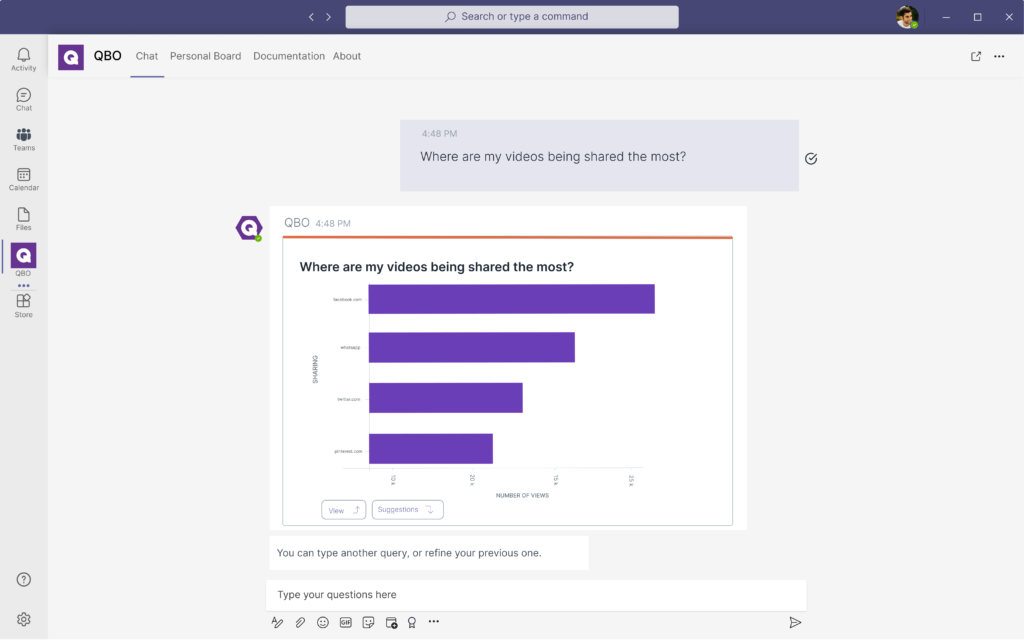
6. Social Shares
The social shares metric in your YouTube Analytics sharing page showcases the number of shares received and where they came from.
This includes sources such as text messages, Whatsapp, Gmail, and other social platforms (eg. Facebook, Pinterest).
Understanding the origin of your social shares is important to understand the virality of your videos and which platforms make the best sense to promote and distribute your content.
With business intelligence, you can also take a birds-eye view of your total social shares across every video to make a stronger case for your distribution strategy by simply asking:
“Where are my videos being shared the most?”
7. Unique Viewers
This metric essentially informs you of the number of individuals who watch your video over a certain time period.
Unlike the total number of views, your unique viewers provides a good look at how big your actual audience is.
If your unique viewers are lower than your subscriber count, that means your subscribers aren’t being informed about your videos, allowing you to remind them within the videos and the caption to hit the notification bell.
In contrast, if your unique viewers are greater than your subscriber count, you will know that you are reaching new viewers besides your existing subscribers, perhaps from the Explore page or suggested feed – this is a sign of healthy channel growth.
8. Impressions Click-Through Rate
Your impressions click-through rate is an important metric that showcases the number of impressions that translate into views.
The higher the impression click-through rate means the more people who saw your thumbnail clicked through to view your video.
This metric is useful for you to discern how compelling your thumbnail and video titles are to your audience.
With business intelligence, you can immediately learn from this metric and start observing patterns of thumbnails and titles that resonate by simply asking:
“Which of my videos have the highest impressions click-through rate”
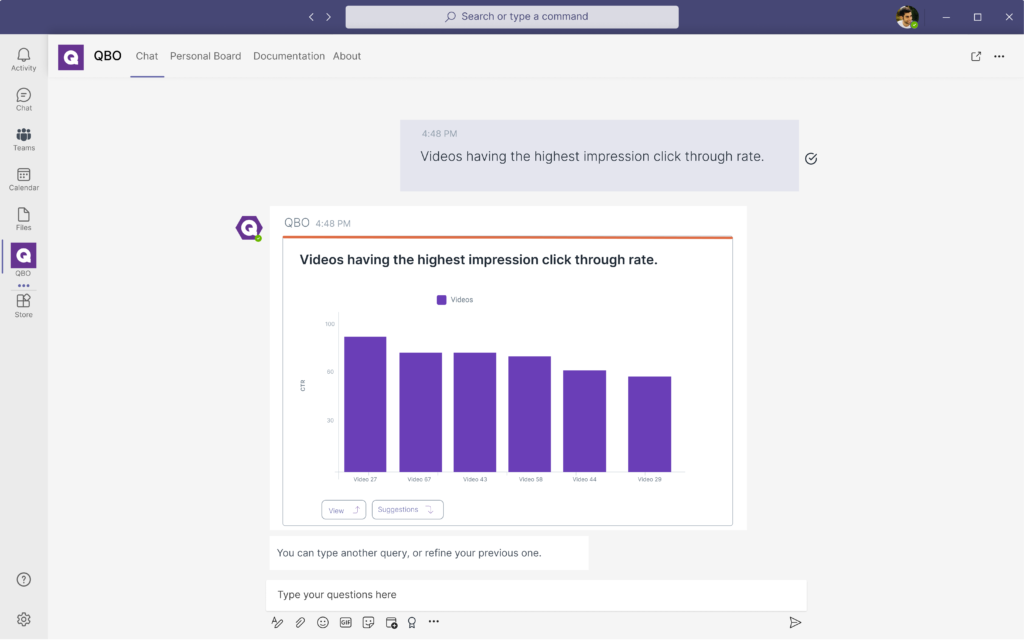
Allowing you to learn what works from your very own videos to better note down the formats, design, and video title structure.
9. Subscriber Growth
Your subscriber growth is the ultimate metric that underscores if your content strategy is working enough to bring you business results.
Subscribers aren’t just viewers who want more of your content, they are likely to become customers and brand advocates. They are likely to share your videos around, watch them to the end, purchase products that you release, and even become paid members of your channel.
In fact, subscribers watch twice as many videos as compared to non-subscribers.
Monitoring your subscriber growth is key to understanding if your content truly resonates with your content.
With business intelligence, you will be able to swiftly determine the videos that earned the most subscribers by asking questions such as:
“Which of our videos earned the most subscribers within 90 days of uploading it?”
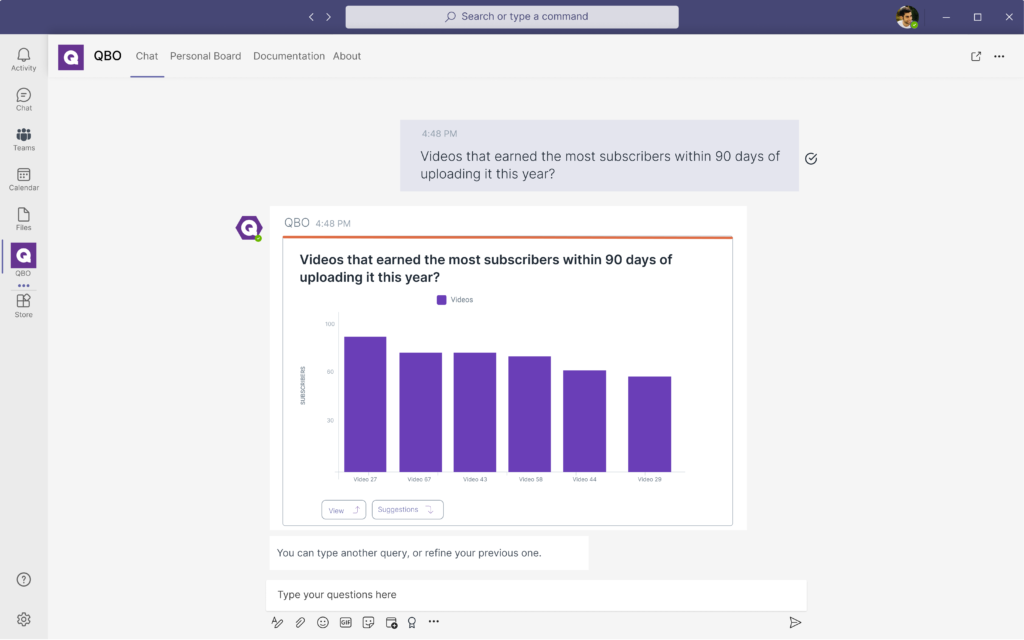
This will allow you to closely study those videos in particular to learn more about where the subscribers came from, the videos’ formats, and the content, allowing you to better replicate their success.
10. Audience Demographics
Understanding your audience demographics is important when it comes to refining your audience persona and content strategy.
The metrics will showcase the different types of people who are watching your videos by age, gender, and geography.
By monitoring this set of metrics, you will be able to discern if your overall strategy is on-point or if it might be better to pivot your content creation to attract the group that you truly want.
Alternatively, by understanding your audience demographics, you also can conversely choose to double-down and focus on creating the content that is currently drawing the most audience.

Grow Your YouTube Channel Faster With Actionable Insights Today
Growing your subscriber base on YouTube doesn’t have to be difficult, however, it’s important to track the right metrics and not get lost in a sea of data.
At Unscrambl, we developed Qbo, a business intelligence tool powered by conversational analytics perfect for today’s augmented marketing consumer.
Using Qbo, marketers on YouTube will be able to analyze their metrics and gain deeper and more impactful insights to create content that truly resonates with their audience.
Users will be able to reap the benefits of true data democratization to build a data-driven culture beyond just digital marketing success.
Embark on a free 14-day trial today and start harnessing the power of your YouTube analytics data.